
AxessPoint: Credit markets showed resilience through April volatility

By Hoary Huang, Solenn Maton | 14 July 2025
Text
Highlights:
The credit market demonstrated resilience amid April volatility, maintaining robust trading volumes across various sectors.
Credit spreads widened due to flight-to-quality flows, while bid-ask spreads remained contained compared to previous periods of extreme stress. In contrast to the COVID-19 crisis, dealers stayed active and algos continued to provide liquidity, underscoring the successful growth of algo usage across liquidity providers.
PT volume rose with overall market activity, maintaining a stable share and continuing as a reliable tool for credit markets.
The impact was uneven globally—US markets saw the sharpest disruption but the fastest recovery, while EU and EM markets remained more stable overall.
During the April 2025 tariff-driven market turbulence, credit markets experienced notable but relatively orderly volatility, in contrast to the severe dislocation seen during the COVID-19 liquidity crisis. The April 2nd tariff announcement in the late afternoon resulted in policy uncertainty, causing notable market fluctuations during the following week. Sentiment stabilized following a U.S.-announced 90-day pause on additional tariffs (excluding China) on April 9th (early afternoon).
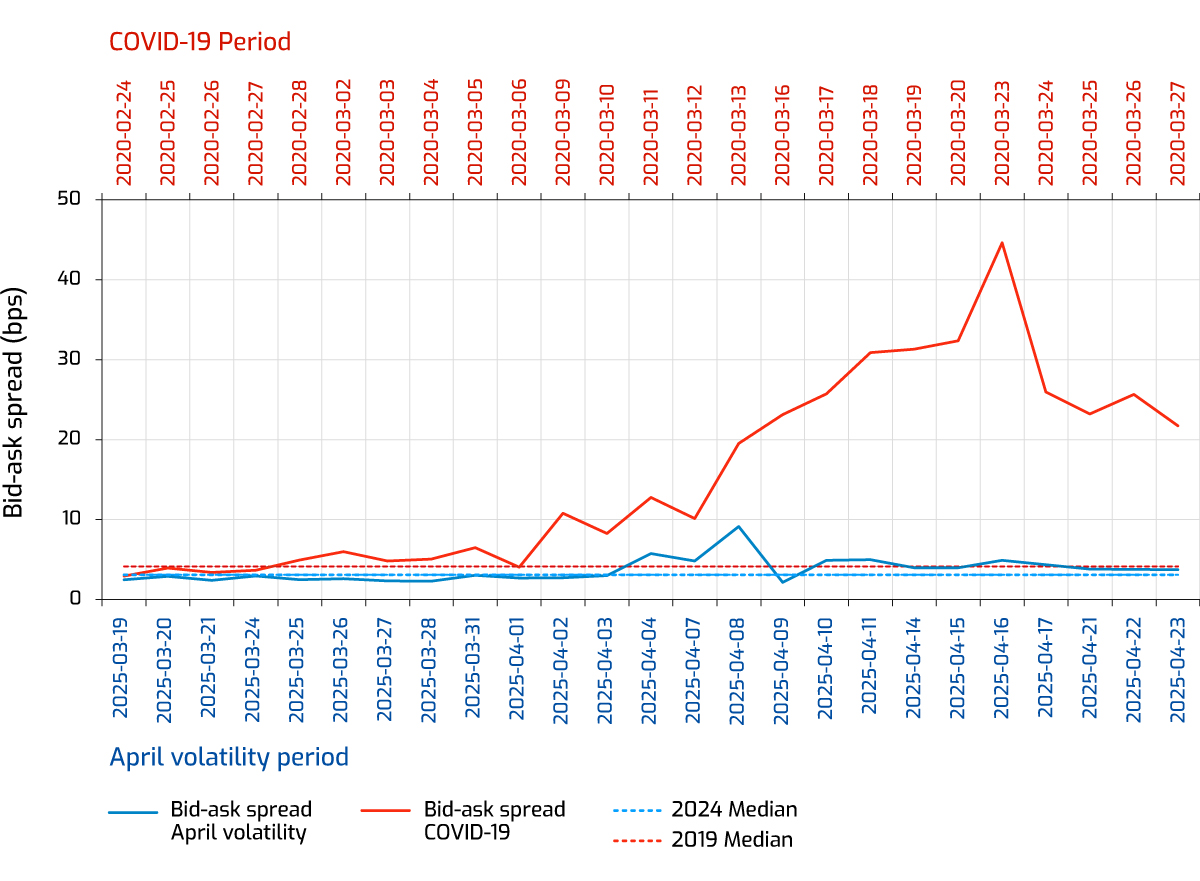
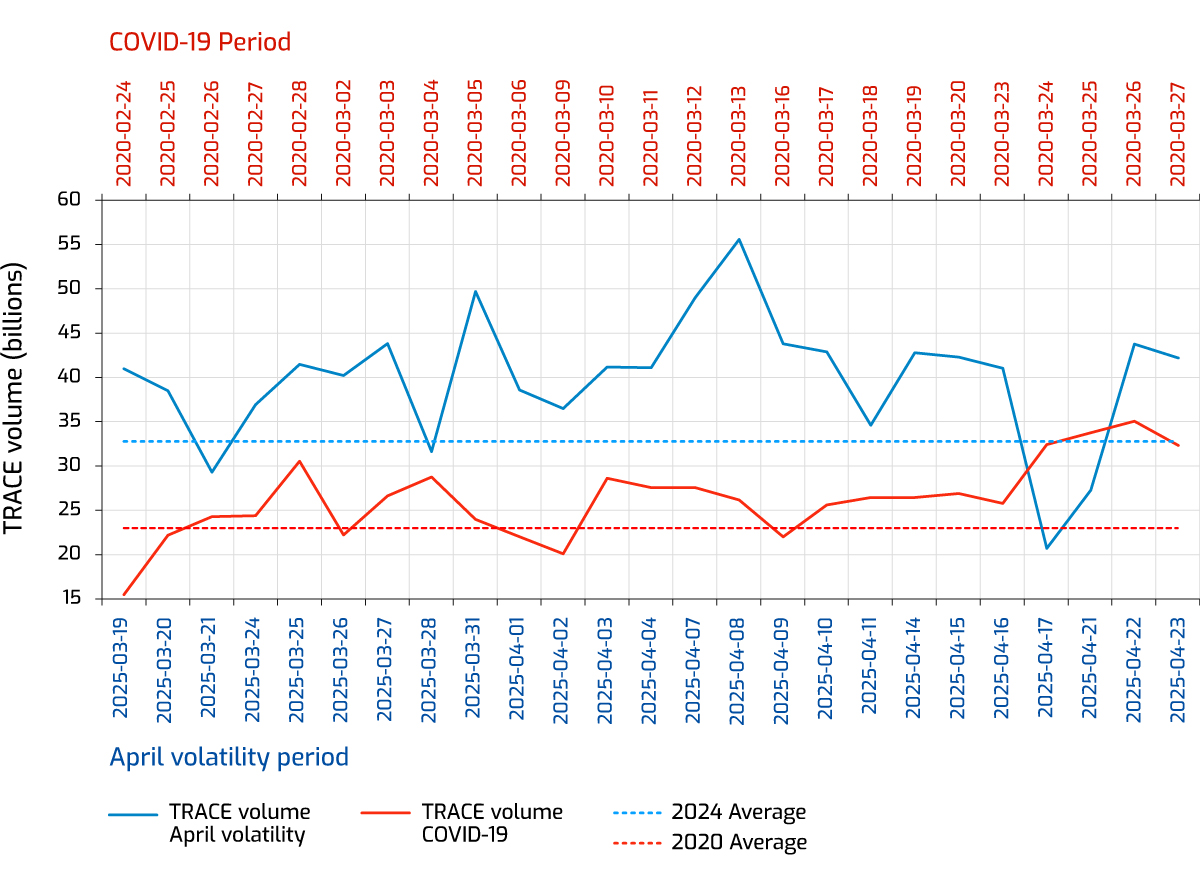
Bid-ask spreads widened substantially during this period, though far less than in 2020. During April turbulence, average bid-ask spreads for US HG reached 9.11bps, reflecting a brief reduced market liquidity period—though still significantly tighter than the 44.62bps recorded during the peak of COVID-19 market stress. Importantly, bid-ask spreads normalized swiftly without the need for large-scale monetary intervention, highlighting improved market functioning and a more tempered assessment of the economic impact of the tariff shock. At the same time, trading activity picked up significantly, with TRACE-reported volumes in US HG reaching record highs. The peak occurred on April 8th, with a total of $55.9 billion traded that day.
US HG Bid-ask spread: April volatility vs COVID-19 period
US HG TRACE volume: April volatility vs COVID-19 period
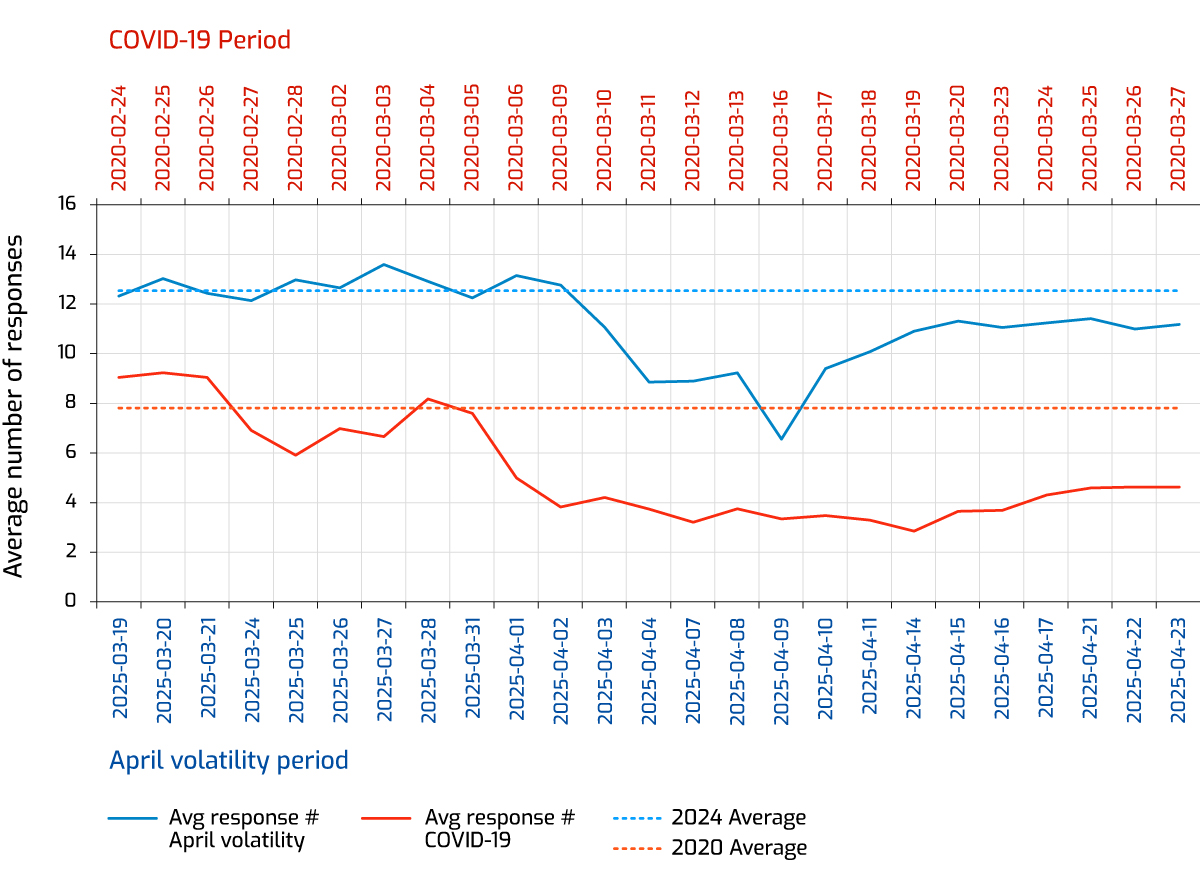
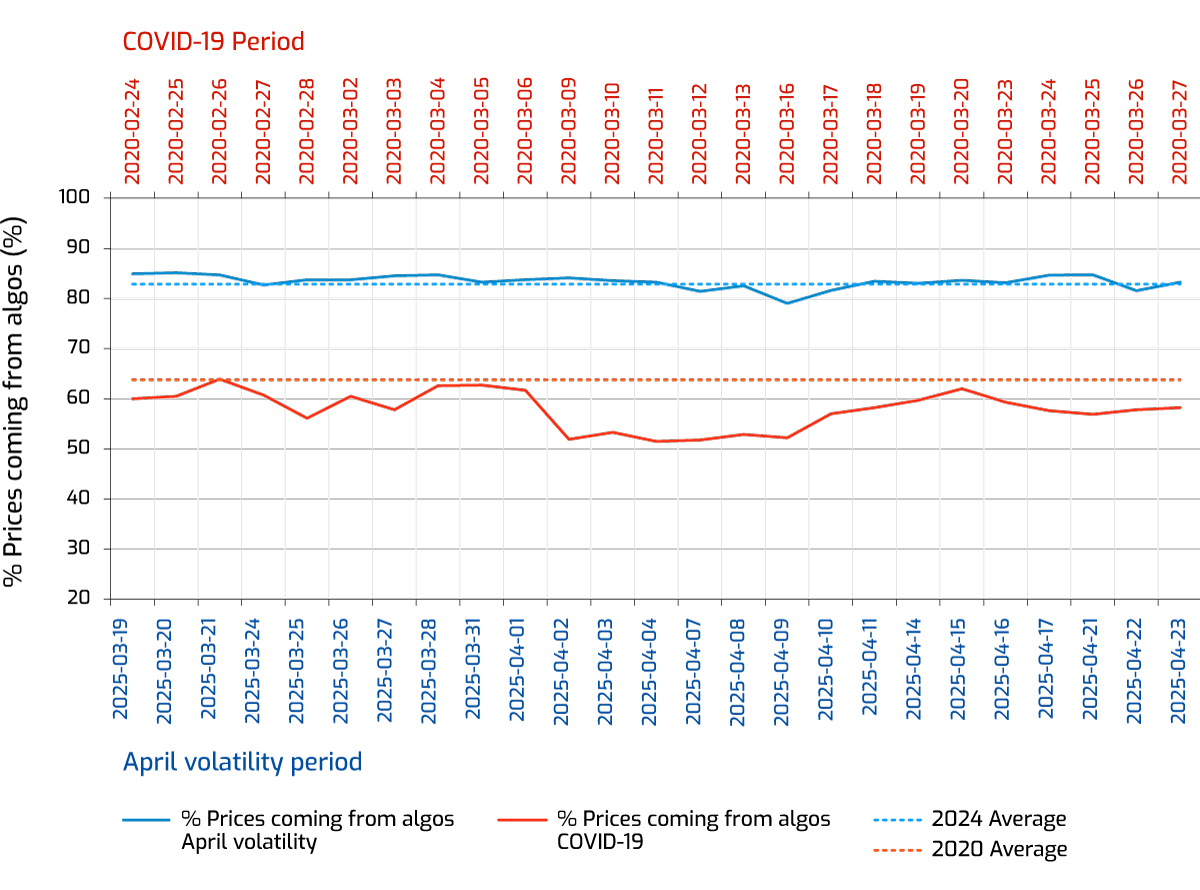
Market depth declined, though the scale of the reduction was modest relative to the COVID-19 episode, and liquidity recovered quickly. In US HG, the average number of prices per RFQ dropped from 13.2 to 6.6 on April 9 but quickly rebounded to 11.3 within a week. By contrast, during the COVID-19 shock, dealer responsiveness remained depressed for a prolonged period. Algo liquidity fell more sharply than non-algo liquidity in 2020 as evidenced by a 10-percentage-point drop in the share of prices back coming from algos—from 60% to 50%. During the recent volatility period, algos showed greater resilience in April with their contribution to overall liquidity provisioned consistently around 80%. This stability underscores the strengthened role of algos in supporting market function during volatility. Similarly, as noted in our recent AxessPoint on algos in block trading, the share of algo responses in block trades has grown significantly over the past four years, highlighting its rising importance in both U.S. and EUR credit markets.
US HG average number of responses: April volatility vs COVID-19 period
US HG % Prices coming from algos: April volatility vs COVID-19 period
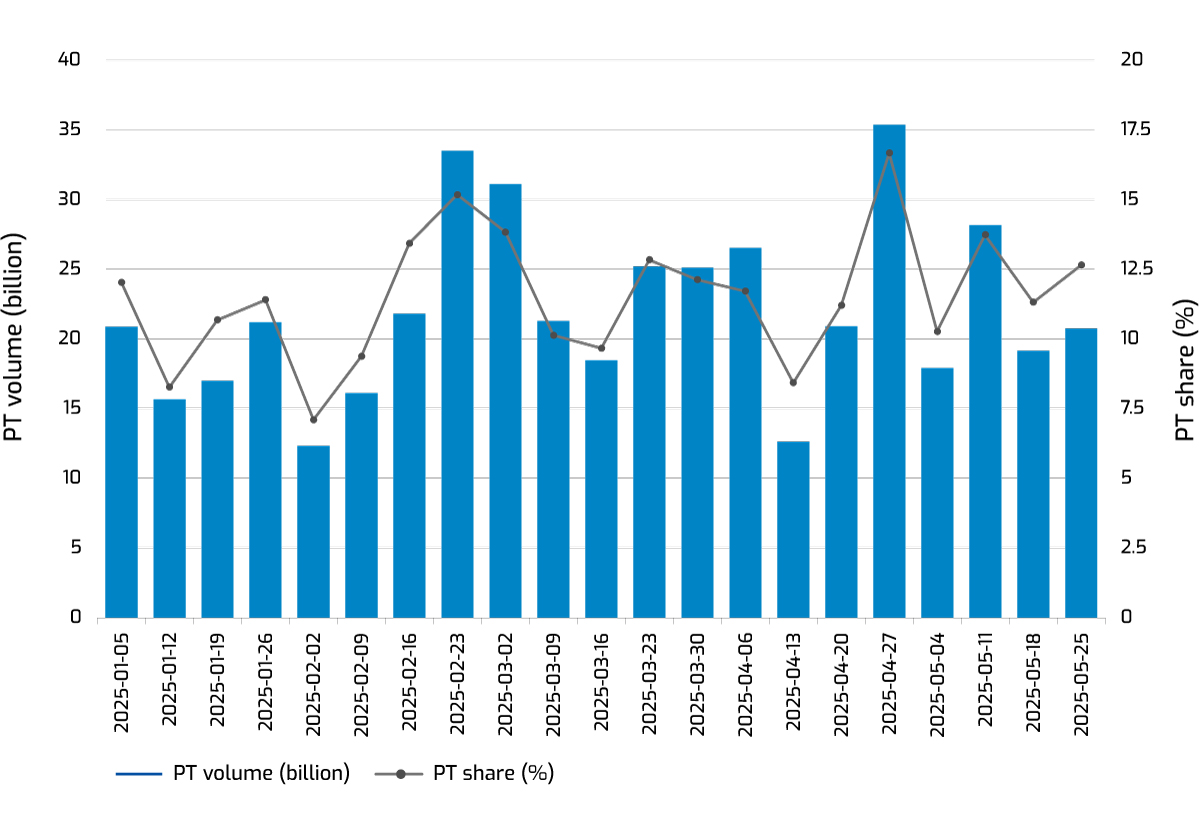
PT activity remained stable during the April volatility, with volumes rising in line with broader market activity. PT continues to offer an efficient channel for executing large risk transfers, even though the execution costs for PT client sells began to rise as market volatility picked up. The absolute volume of PT increased alongside broader market flows, and its share of total activity remained steady during the event—highlighting PT’s established and consistent role in the credit market.
US HG PT volume/share (TRACE)
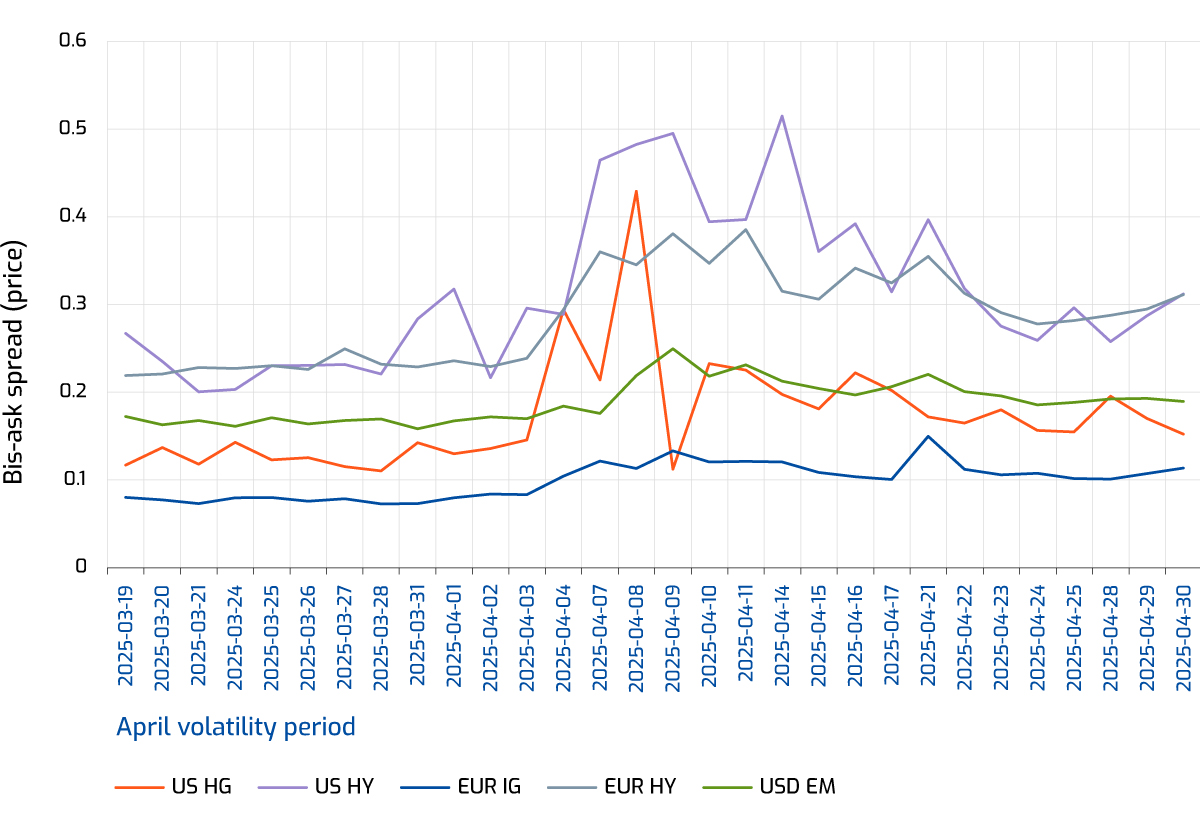
From a regional perspective, the US market reacted the most sharply but also recovered the fastest. Bid-ask spreads for US HG widened by as much as 231% in price but returned to normalcy quickly after April 9. In contrast, bid-ask spreads for EUR IG and USD EM widened more modestly —by 67% and 49% respectively —but remained elevated for a longer period. The divergence was also evident in trading volumes. EUR IG TraX® volumes rose by only 17.5%, whereas US HG volumes surged 59.5% relative to the 2024 average, underscoring the more dynamic response of the US market.
Bid-Ask spread: April volatility across markets
Conclusion
The April volatility highlighted the growing resilience of credit markets compared to past shocks like COVID-19, reinforcing investor confidence in engaging with the market. The increased use of dealer algos and the steady performance of PT underscore how automation and new protocols are strengthening market structure. As these tools become further integrated into trading workflows, they will be key to navigating volatility and enhancing execution efficiency.
Appendix: Comparative metrics highlight resilience across markets
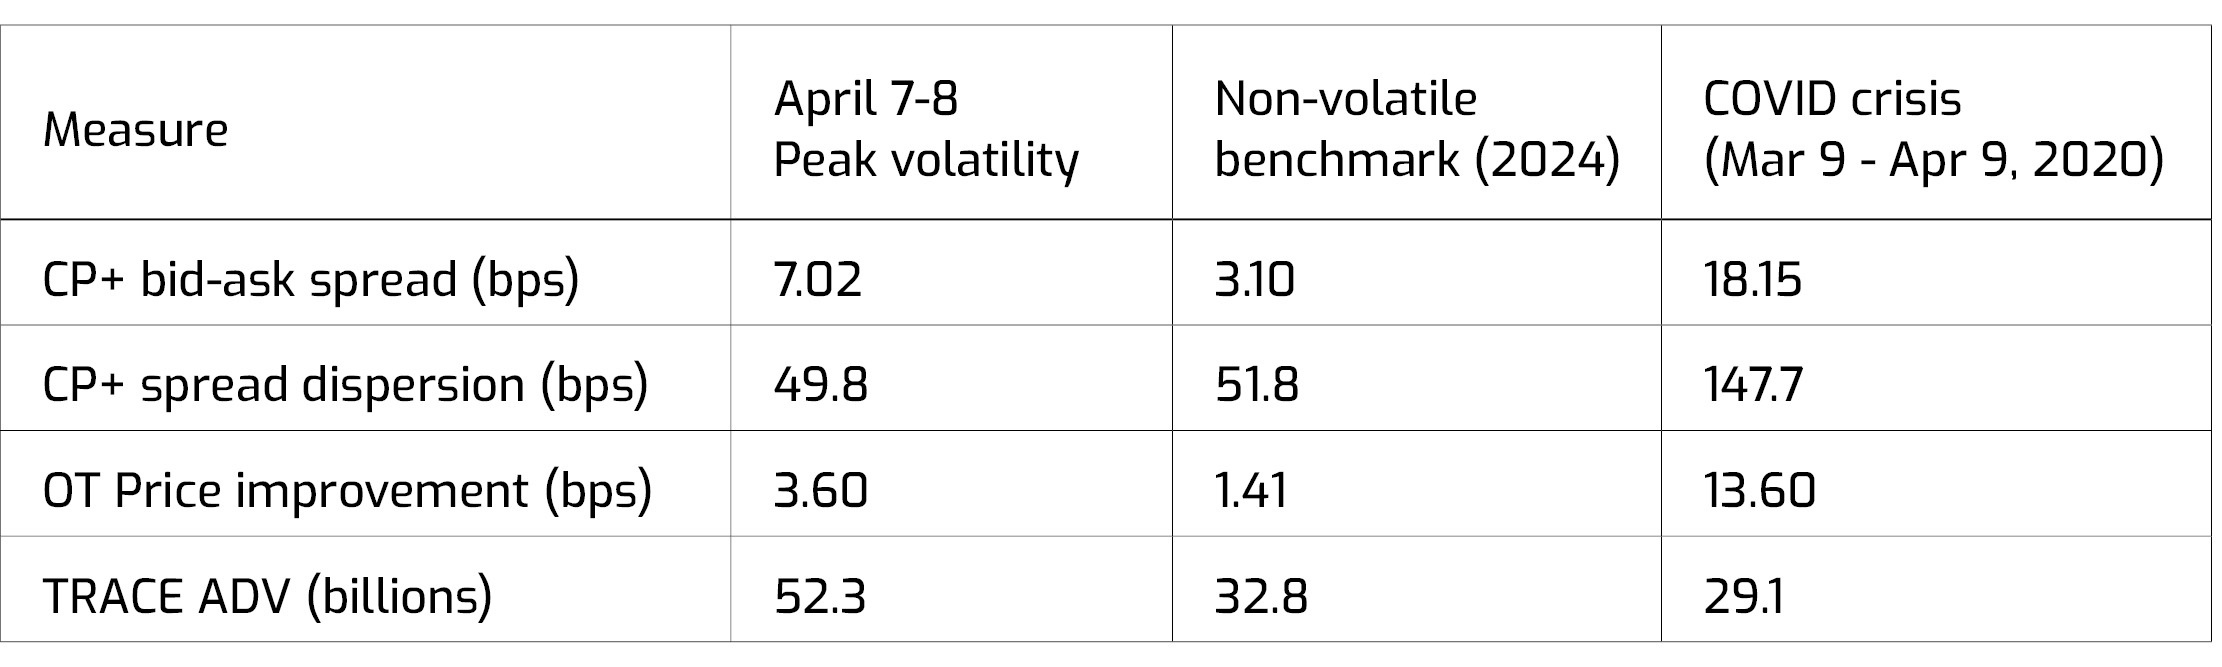
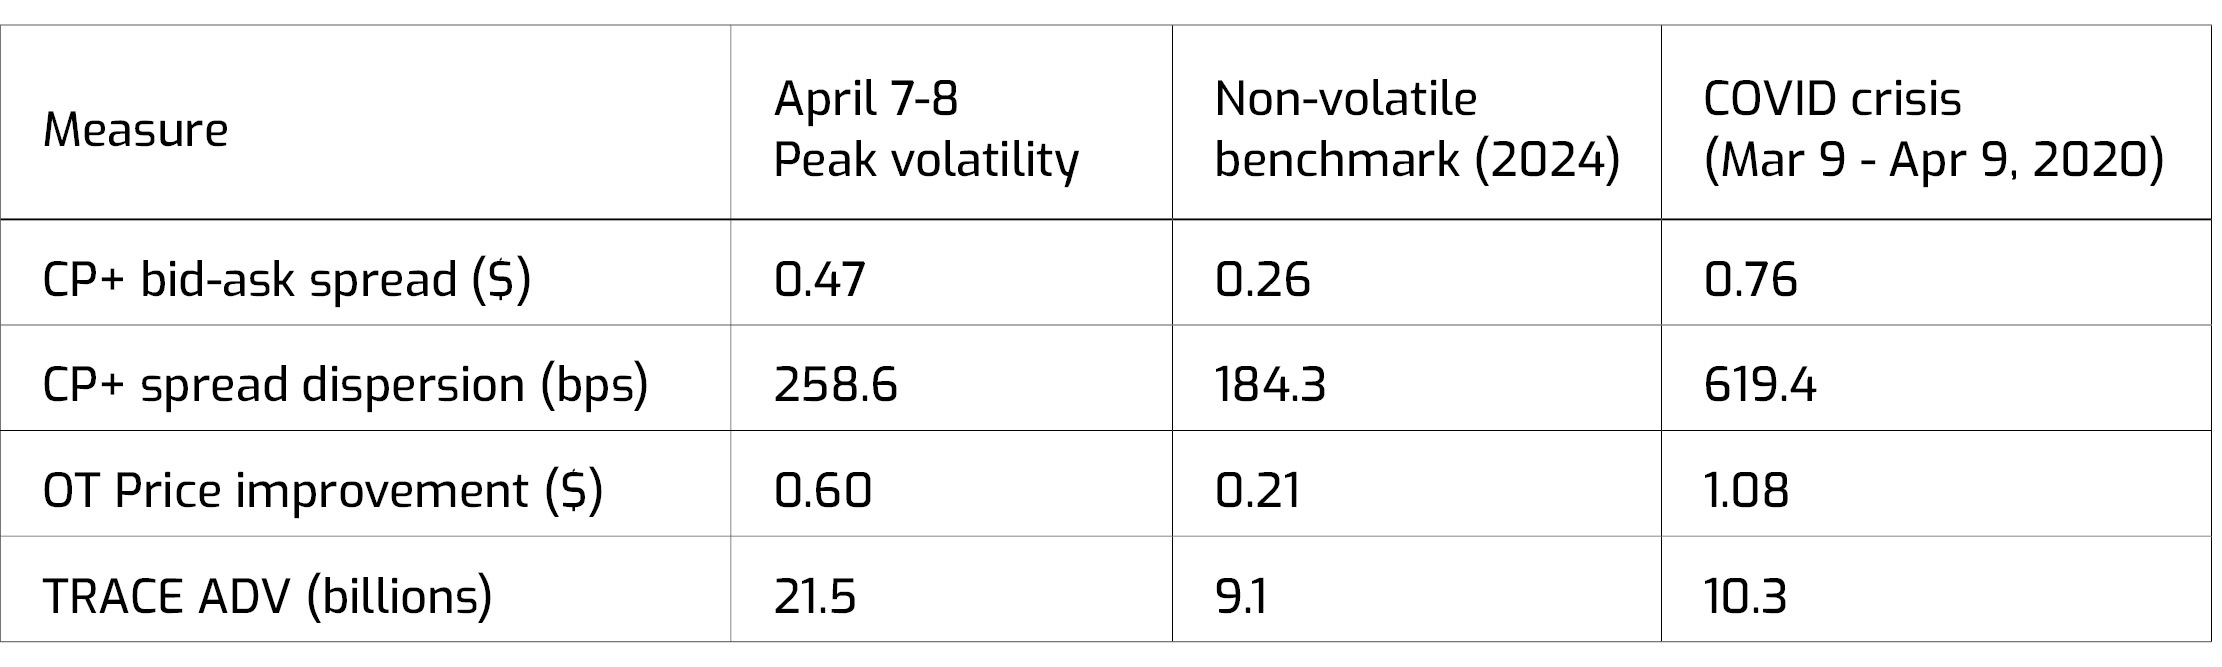
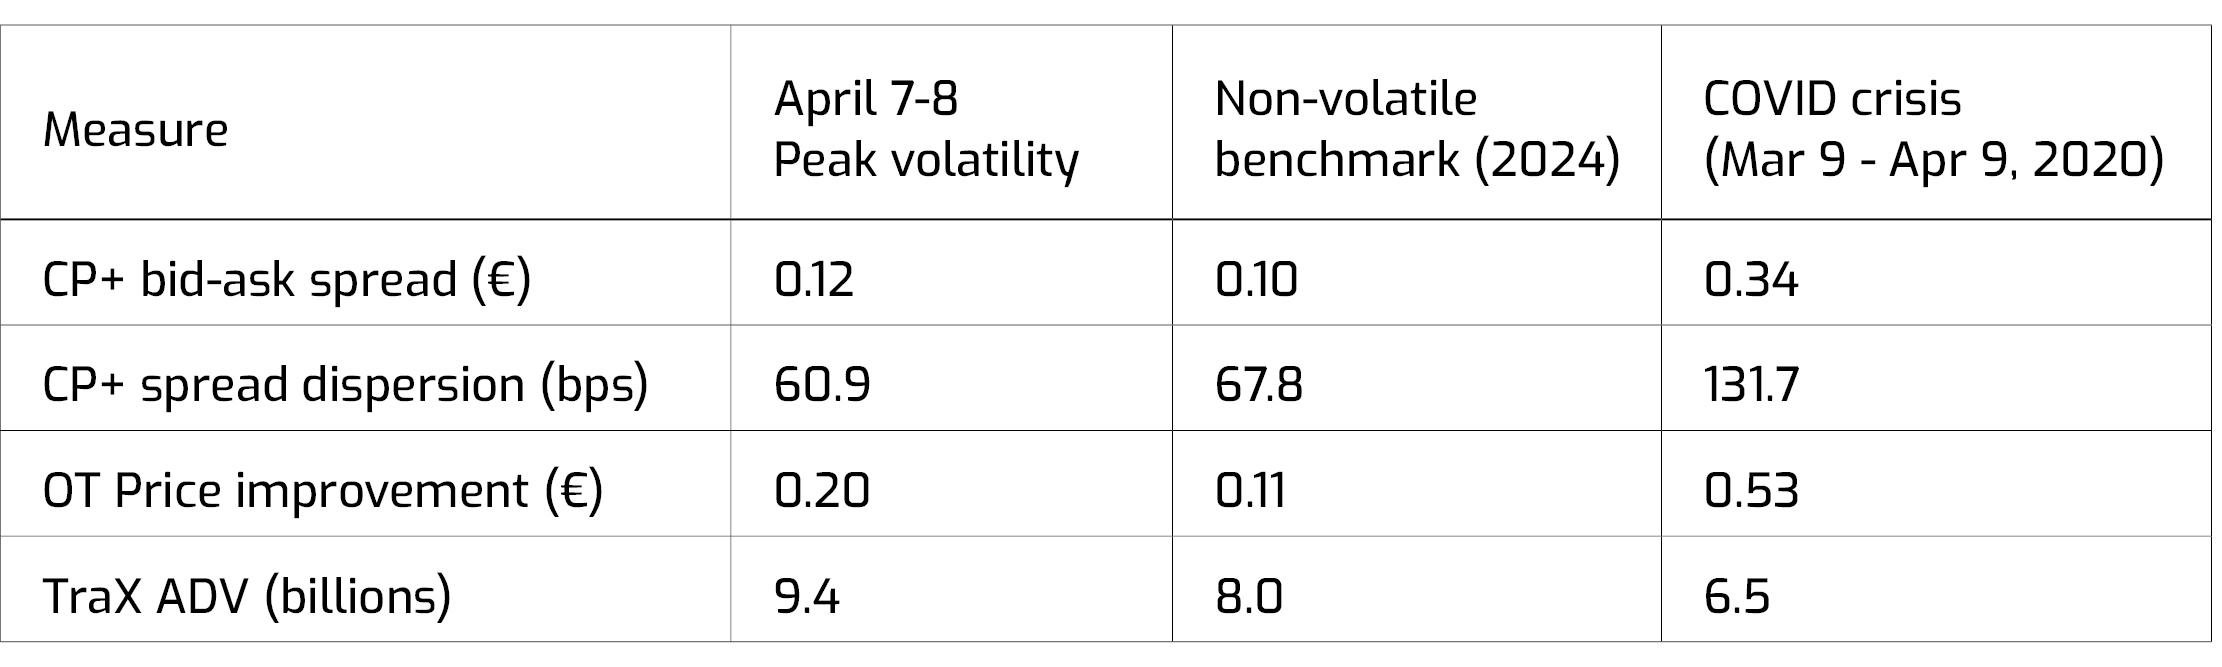
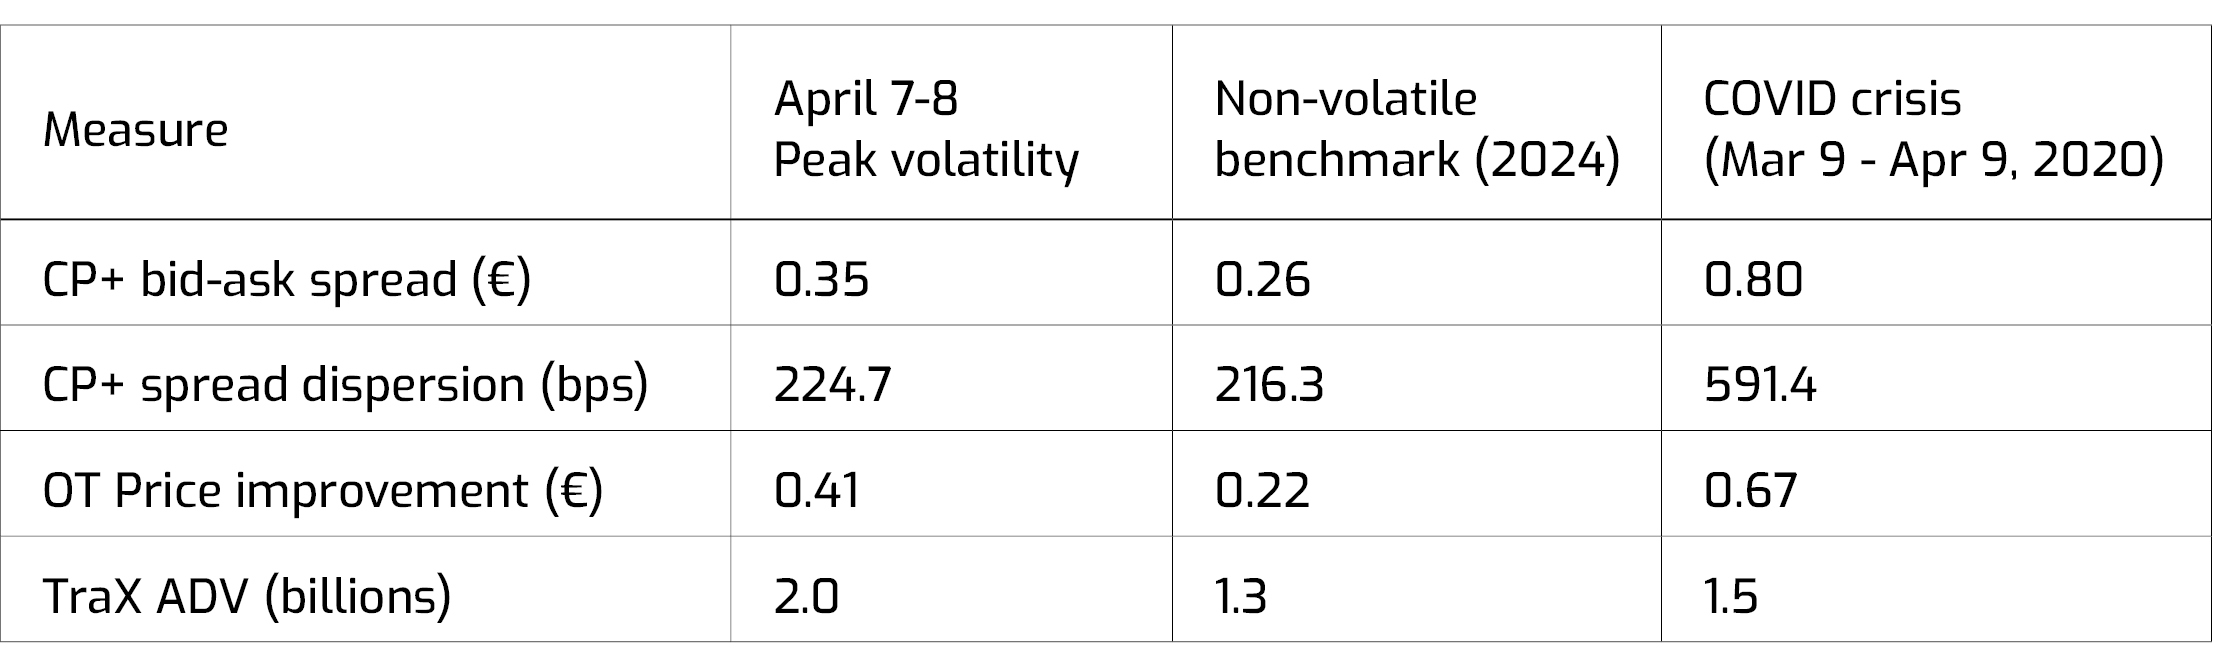
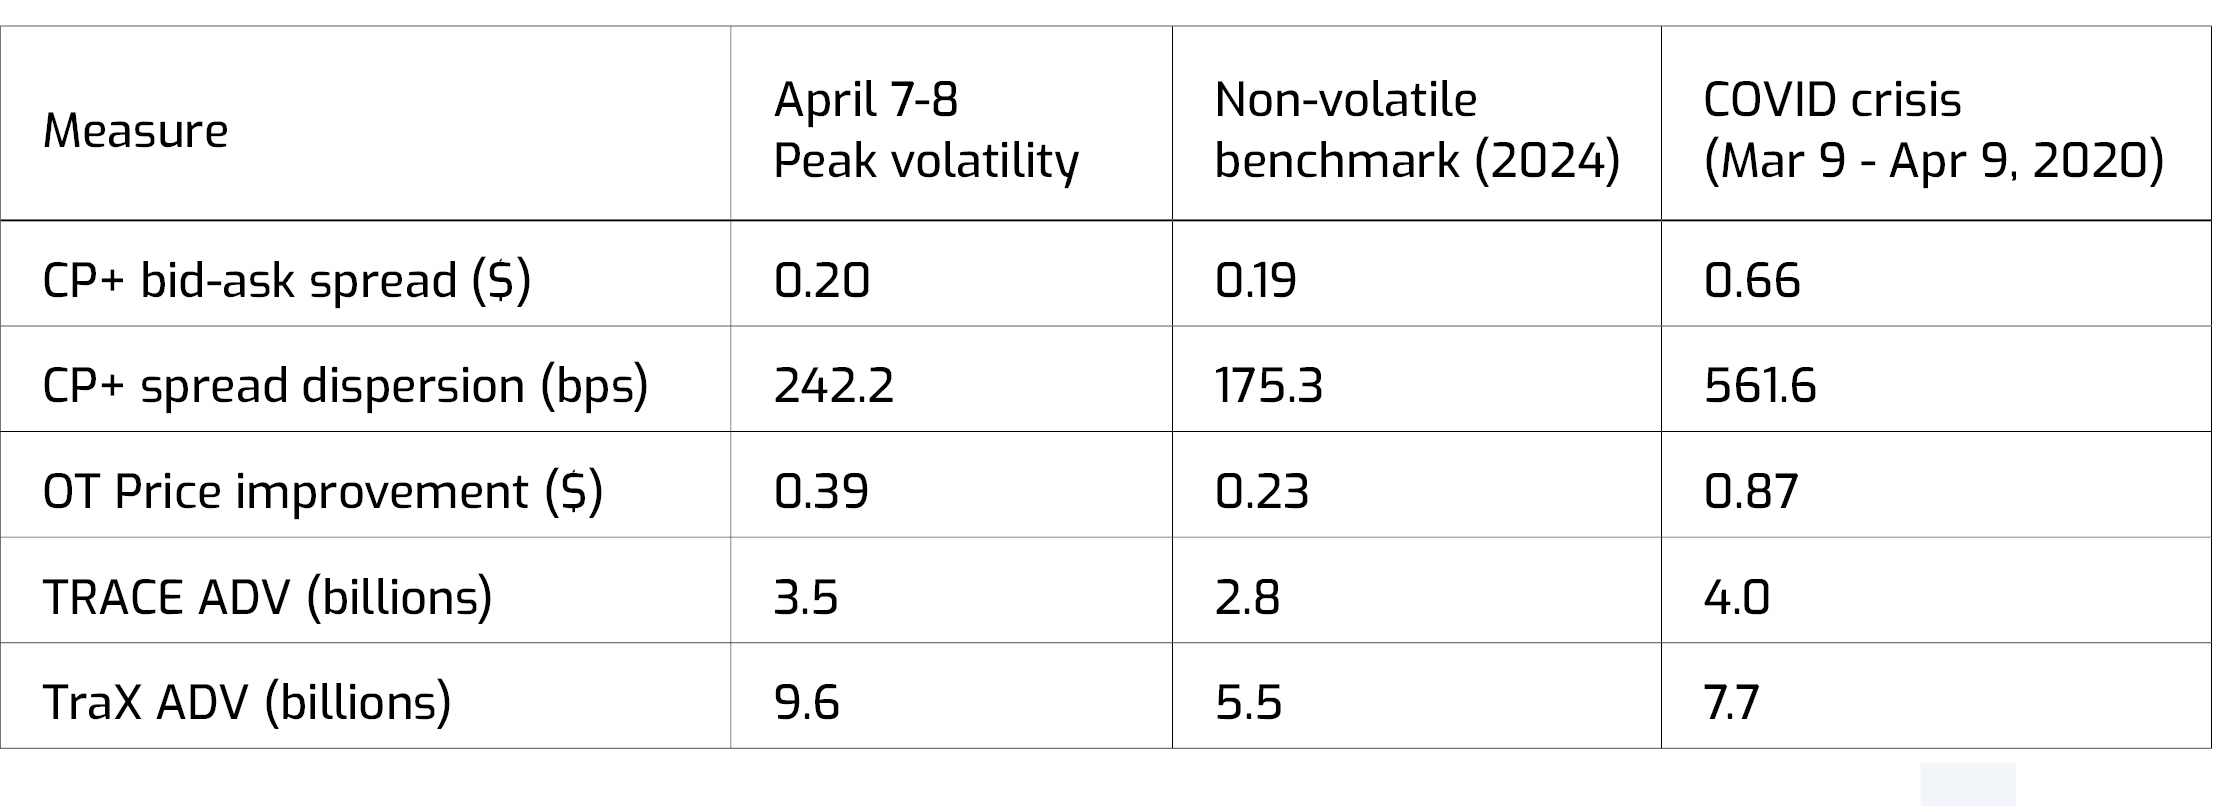
Bid-ask spreads remained contained, and spread dispersion rose only modestly, signaling a more resilient market alongside solid trading volumes globally.
Open Trading® played a key role in supporting liquidity, driving more than doubled the price improvement for US HG and delivering meaningful improvements across other markets.
US High Grade
US High Yield
EUR Investment Grade
EUR High Yield
USD Emerging Market
Measure definitions:
CP+™ Bid-Ask Spread (bps/$/€): End-of-day bid-ask spread estimated by CP+—The MarketAxess proprietary AI-powered pricing engine—across the full bond universe.
CP+ Spread Dispersion (bps): Interquartile range of CP+ credit spreads, calculated as the difference between the 75th and 25th percentiles.
OT Price Improvement (bps/$/€): Average price improvement achieved via Open Trading, measured by the difference between the Open Trading trade level and the best disclosed cover level in the response stack.
% of Responses from OT: Share of total dealer responses originating from Open Trading protocols.
TRACE ADV (billions): Estimated average daily trading volume reported to TRACE.
TraX ADV (billions): Average daily trading volume reported to TraX.