
Liquidity under pressure: What oil shocks really do to HY energy markets

By Patrick Lenhart | 26 May 2026
Text
The return of oil toward $100 a barrel amid escalating tensions with Iran has triggered a familiar stress test for high-yield energy markets, where rising volatility is typically expected to erode liquidity.
But recent trading data tells a different story. Liquidity has not disappeared during this period of stress — it has become more electronified, and more valuable to access if you know where to look. On the MarketAxess platform, high-yield energy volumes have increased meaningfully even as broader market activity softened, while the price impact of each additional dealer response has risen sharply.
What the data actually shows
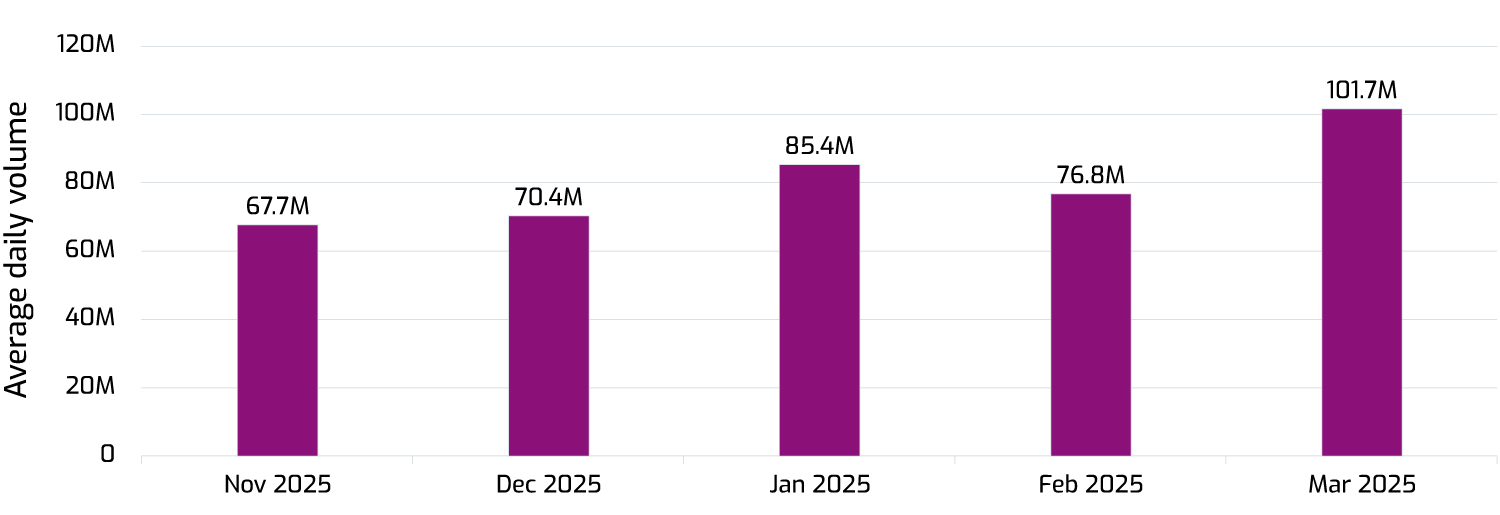
The shift begins with where trading is actually occurring. In the 4 months leading up to the conflict, high-yield energy activity on MarketAxess averaged roughly $75 million in average daily volume. In March, that figure rose to more than $100M. Over the same period, overall high-yield energy volume across TRACE declined. Pre-war, the HY energy market saw $5.6bn in average daily volume (ADV) across 13,100 trades on average. Post-war, that has adjusted to an ADV of $4.2bn across 10,800 HY energy trades according to TRACE data.
HY energy ADV MoM
Why liquidity fragmentation matters
At the same time, the economics of execution have changed materially. Prior to the onset of volatility, each additional response in HY energy delivered roughly two cents of price improvement. Since the conflict, that figure has increased to closer to three cents per additional response.
In practical terms, each incremental response is now more impactful — reflecting a market in which competition is more valuable as spreads widen and pricing becomes less certain.
Counting on liquidity
For HY energy traders, the message is clear: liquidity is still there, but it is less forgiving. As depth fragments and spreads widen, execution depends more on generating competition. The rise in response rates — from 6.4 to 7.4 per inquiry — translates into roughly 3 cents of improved execution, helping offset the cost of volatility. In oil-driven dislocations, liquidity is not just a market condition — it is a driver of performance.
Avg. HY energy responses per inquiry QoQ1
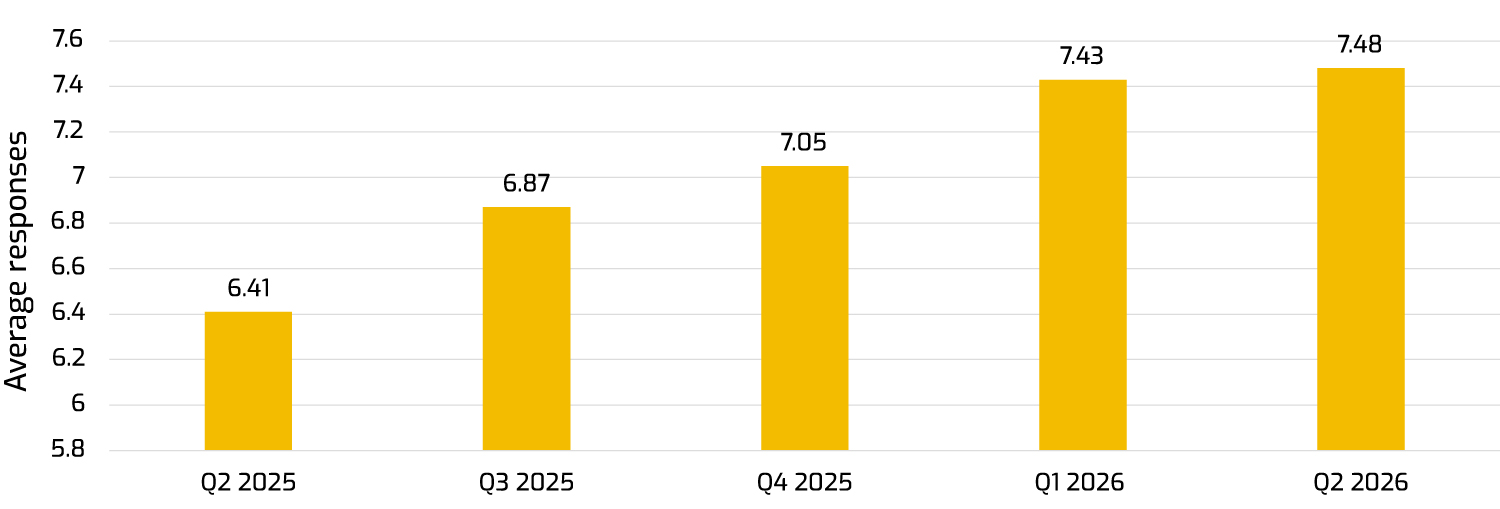
1 Note, before the conflict, each additional dealer response generated roughly ~2c of price improvement (TCA), and as mentioned, that figure post-war has increased to ~3c per additional response.
The bigger takeaway
Taken together, the data suggests a fundamental shift in how liquidity behaves under stress. Traditional indicators — lower overall volume, wider spreads — point to deterioration. But beneath the surface, liquidity is not vanishing. When volatility increases and liquidity decreases elsewhere, activity actually increases on our MKTX platform. In this environment, execution is no longer defined simply by access to liquidity. It is defined by the ability to generate competition.
For high-yield energy traders, that distinction matters. As dealer balance sheets tighten and risk becomes more selective, the dispersion between strong and weak execution outcomes increases. Trades that attract multiple responses continue to clear efficiently, while others face materially higher costs.
The result is a market where liquidity depth is no longer just a background condition — it is a direct driver of performance. In oil-driven dislocations, volatility does not eliminate liquidity. It raises the price of accessing it.