
The market is adapting: what six months of transparency reform reveal about how bonds trade

By Andrew Draper, Niamh Clerkin | 9 October 2026
Text
In the last year, the UK Financial Conduct Authority ("FCA") and the European Securities and Markets Authority ("ESMA") introduced their new post-trade transparency regimes. As we set out in our previous article, the reforms widened the scope and sped up the timing of post-trade disclosure.
Six months on from the last of these changes, the data suggests that the market has accepted the new rules and is actively trading around them. Volumes are up, and tickets are getting bigger. Activity is moving towards more liquid assets, and we can see some corners of the market lining up to just above the deferral thresholds allowing for delayed publication.
To measure these changes consistently, this analysis compares 2025 and 2026 levels using the TraX® data universe, covering approximately 85% of the European and UK fixed income market. TraX Tape also ingests the FCA’s consolidated tape; although the feed is not included here, to keep the year-on-year comparison like-for-like.
Volumes increased, with the UK market reluctant at first
TraX data shows trading volumes rising in the six months after each regime went live. But the UK market saw some reluctance at first.
Under the FCA regime, activity was subdued for the first two months before moving above year-earlier levels. When ESMA’s regime followed three months later, we didn’t see this same dip. The volumes rose straight away.
One read of this is that the UK acted as the market's test run. By the time the ESMA rules had arrived, market participants had already seen how greater transparency played out in practice. This pattern is consistent with feedback from our clients that the market is getting more comfortable with the new regime.
Widened conditions may have also influenced activity. With heightened geopolitical volatility, the increase cannot be solely attributed to the transparency regimes alone.
Markers outside of the new regimes help to separate these effects. TraX data covering regions such as APAC and the US showed lower volumes and reduced volatility over the same period. These markets aren’t directly comparable, but they are a reasonable proxy for how the markets would trade without the introduction of transparency rules. The divergence suggests that trading activity in the FCA and ESMA jurisdictions was comparatively stronger than in the rest of the world under broadly similar macroeconomic conditions.
YoY change in monthly trading volume (2026 vs. 2025)
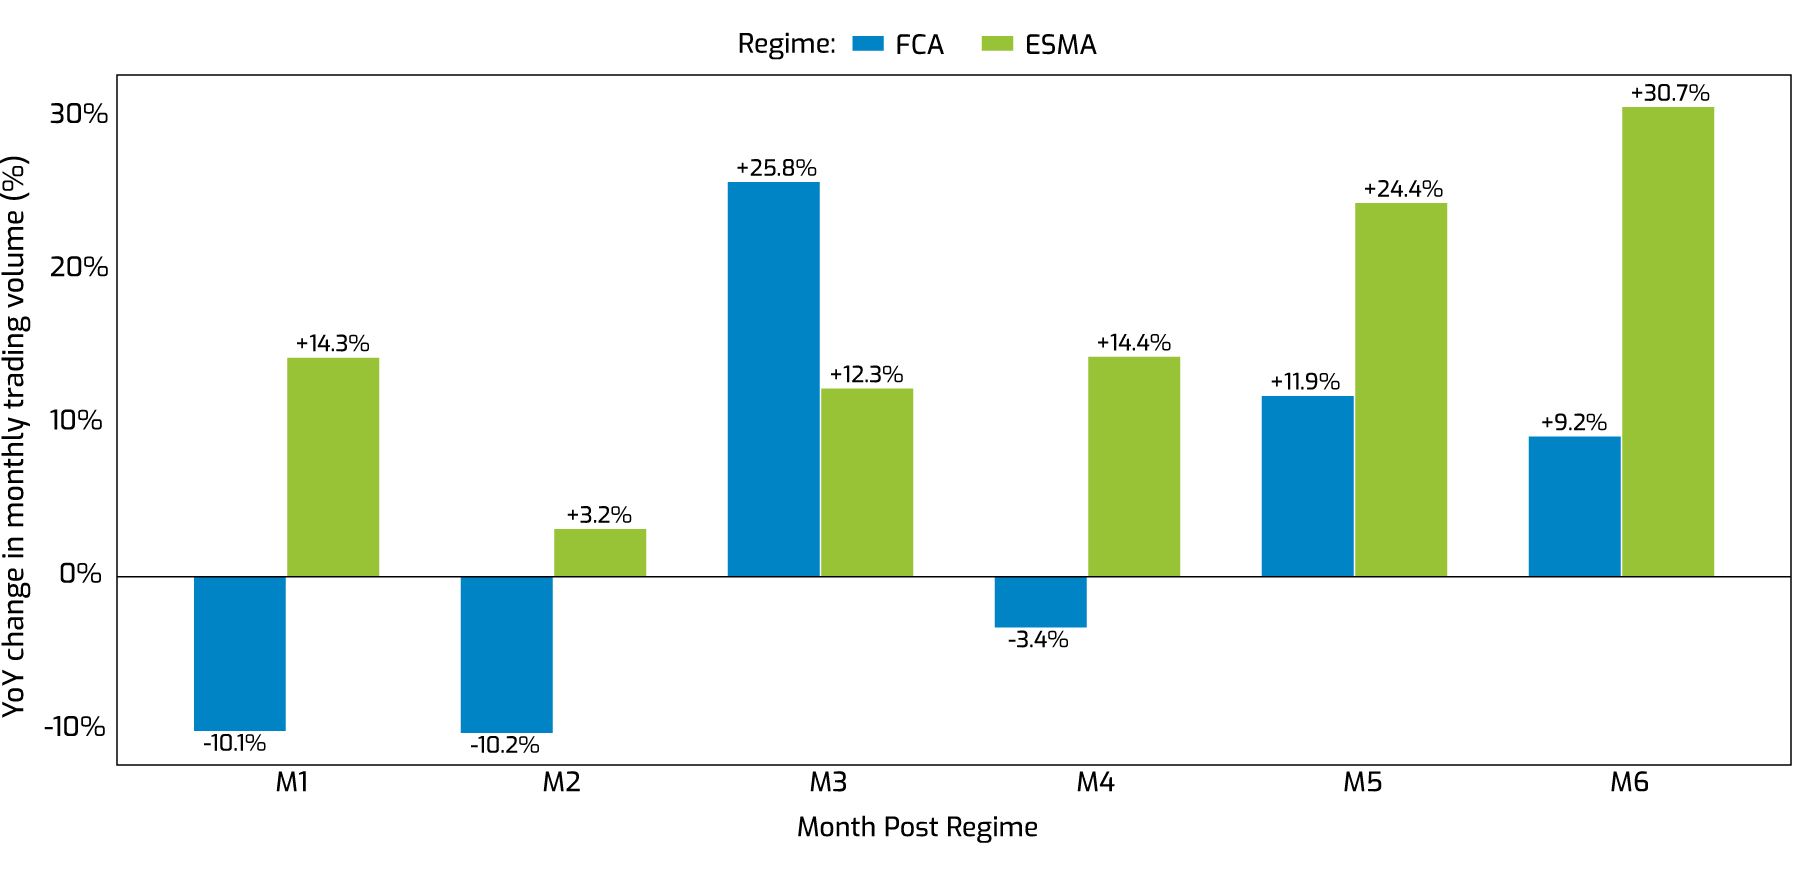
The x-axis shows months since the regime change. The y-axis shows the year-on-year change in monthly trading volume (2026 vs 2025), split by regime. Source: MarketAxess TraX.
Bigger tickets, later prints
The key question surrounding the new transparency regimes has been whether participants would adjust the size of their trades to take advantage of deferrals.
Under the new legislation, trades above set thresholds are subject to delayed publication, due to sensitivities surrounding trade size or instrument liquidity. For a dealer, this matters. Immediate publication can tell the market that a firm has taken a significant position before it has had a chance to hedge or offload risk.
With this incentive in mind, the market behaved as expected. A participant that might have traded £900,000 of a high-yield corporate bond in London could instead trade £1.1 million and qualify for a one-day deferral rather than real-time publication.
TraX data shows the trade-size distribution under the FCA regime moving towards larger buckets. The effect is strongest at the larger bucket sizes, where deferral periods are longest and the benefit of staying out of view is greatest.
FCA | YoY change in trade count by trade size bucket, trades above GBP 500k (2026 vs 2025)
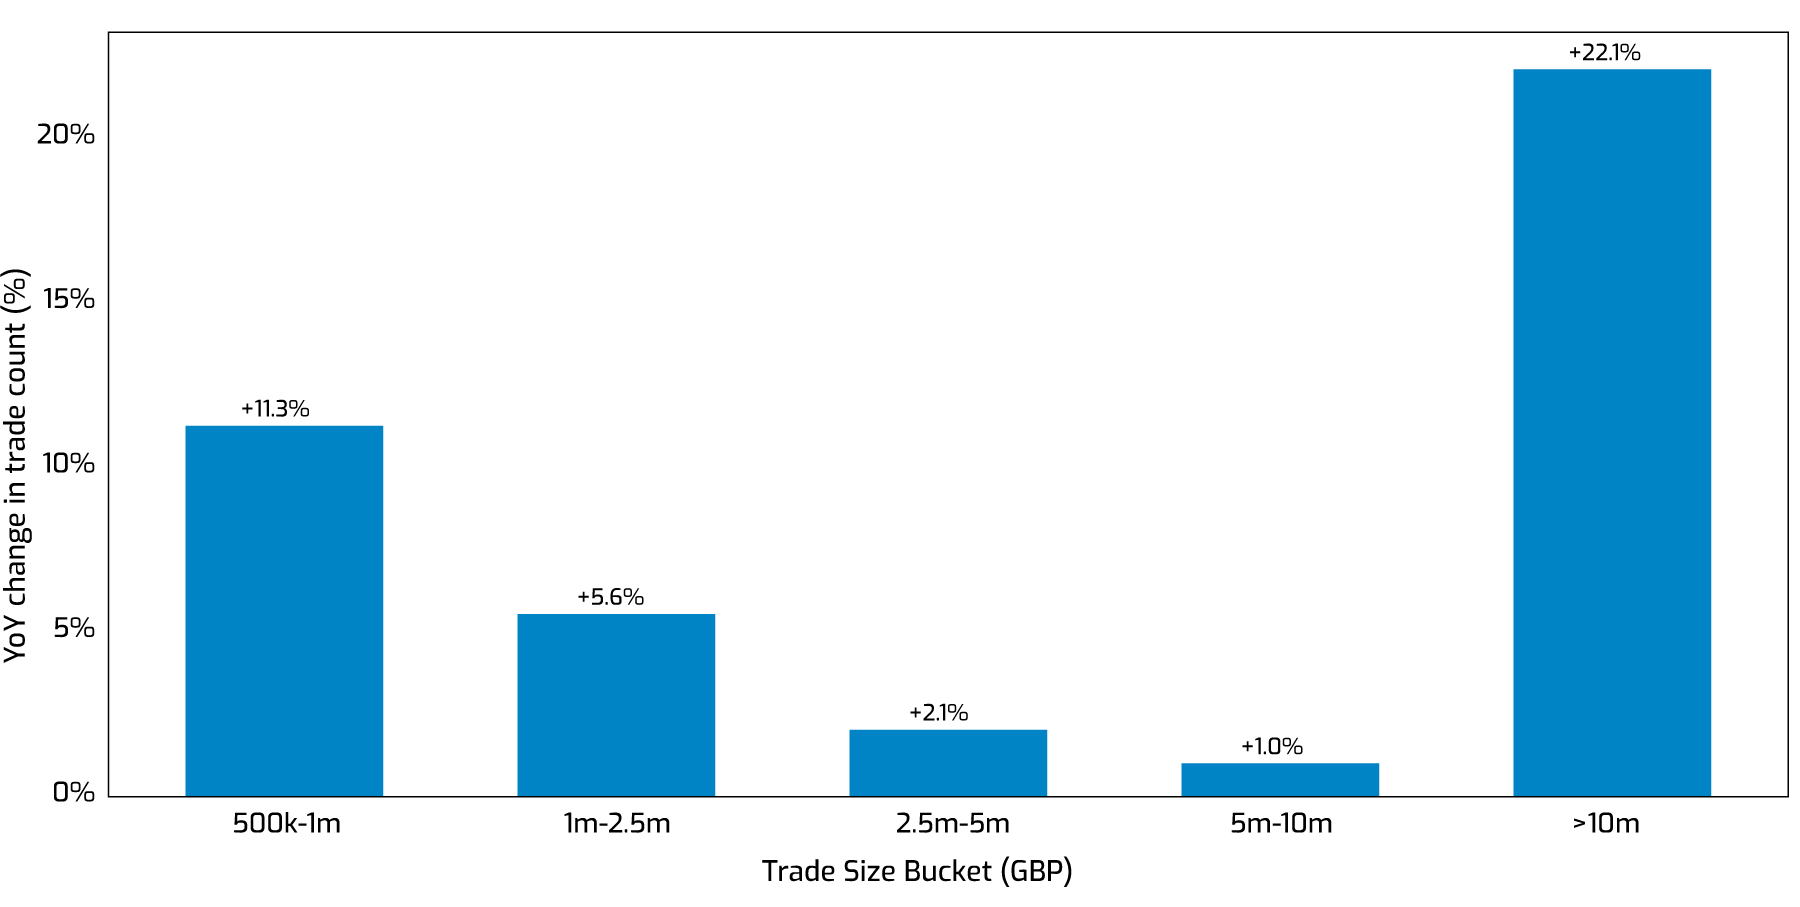
The x-axis shows trade-size buckets in GBP (trades above £500k), aligned to the FCA transparency intervals. The y-axis shows the year-on-year change in trade count in each bucket under the FCA regime. Source: MarketAxess TraX.
A move towards liquid assets
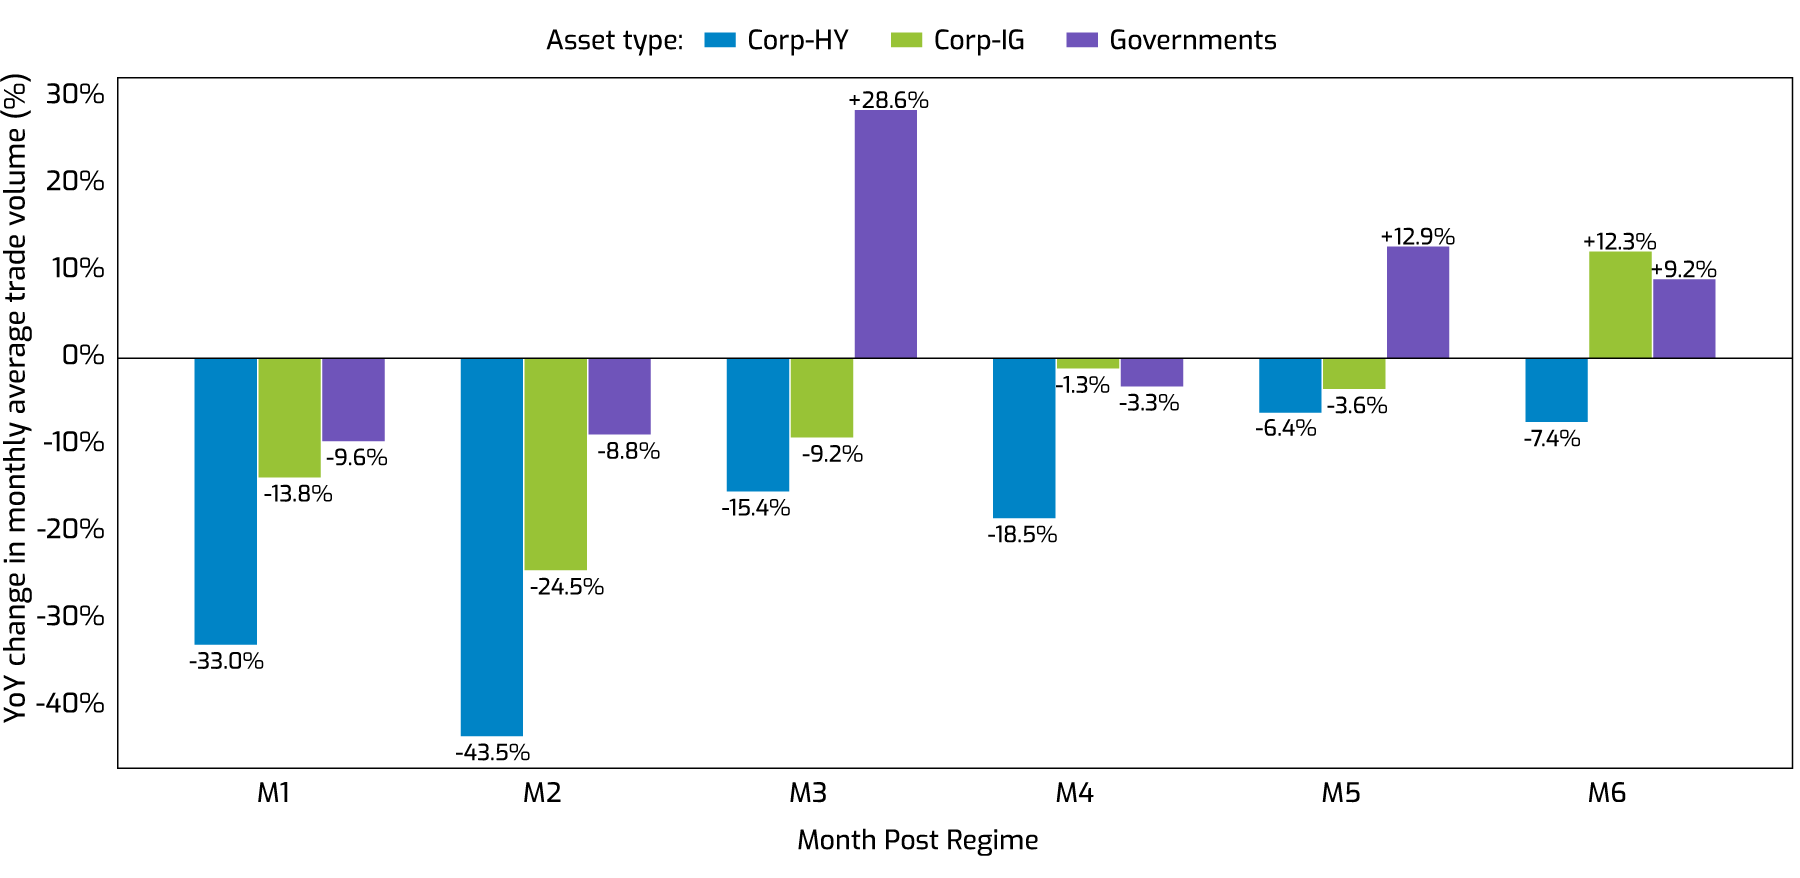
The growth in volume was driven primarily by trading in governments. Corporate high yield saw consistent declines, and corporate investment grade fell to a lesser extent. The same pattern appeared under both regimes.
Part of this pattern is the flight to quality during an uncertain macro backdrop. However, it may also be linked to transparency. In highly liquid securities, one published trade tells the market relatively little, so greater visibility makes transparency less sensitive.
FCA | YoY change in monthly trading volume (2026 vs 2025)
ESMA | YoY change in monthly trading volume (2026 vs 2025)
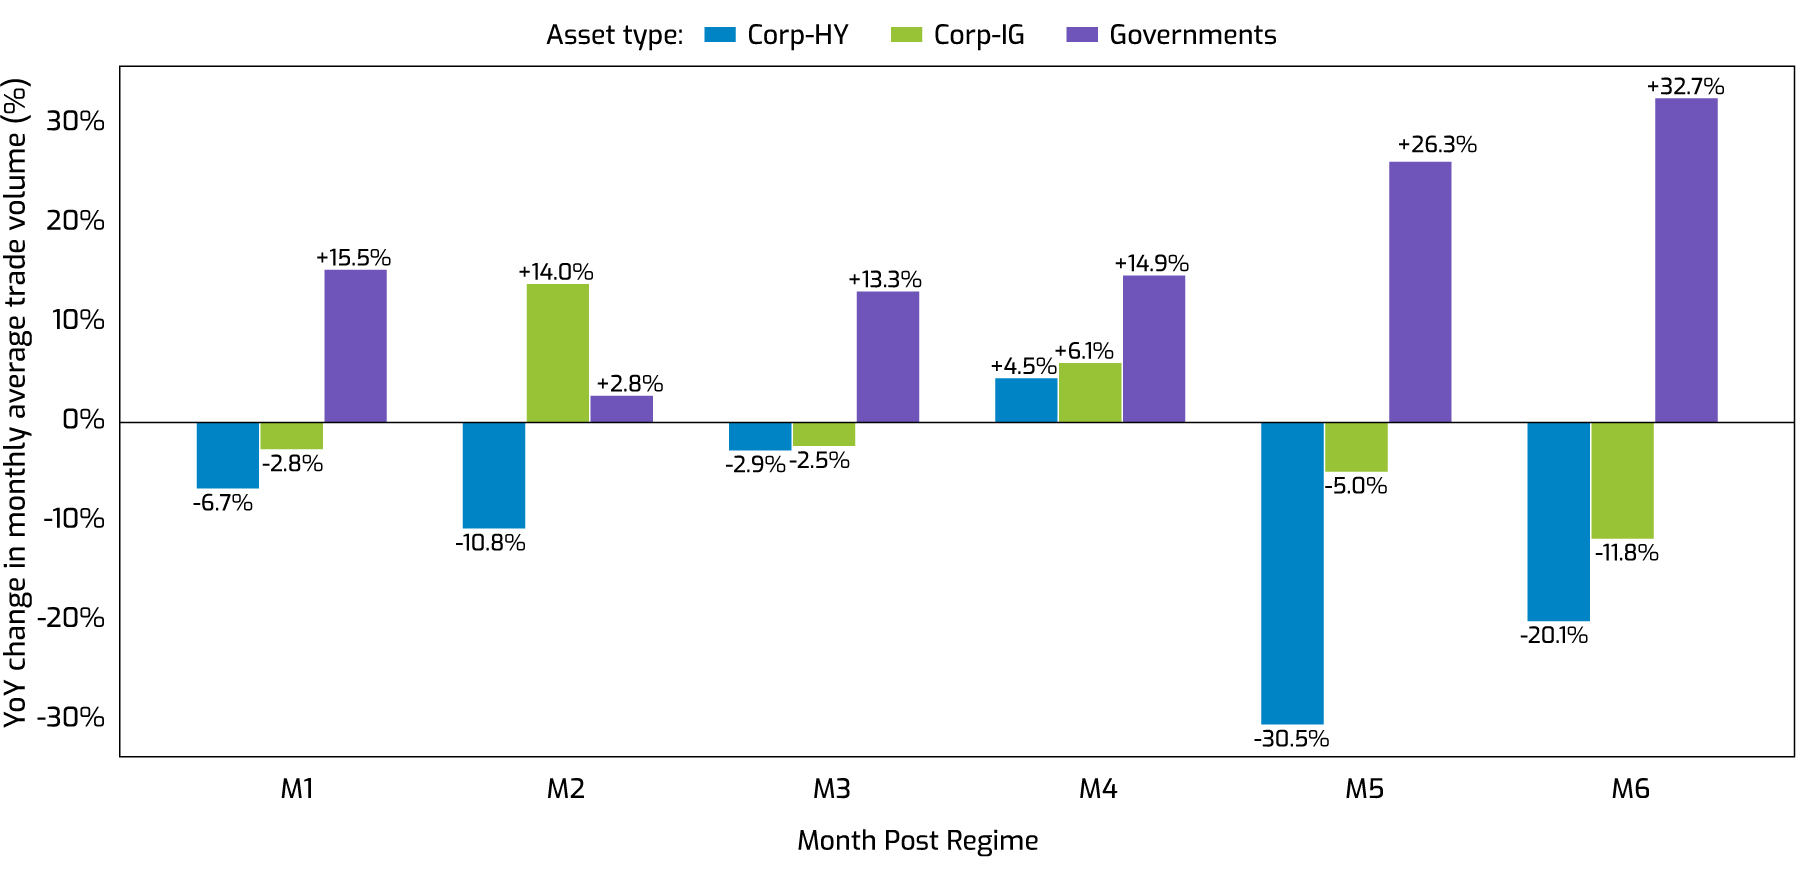
The x-axis shows months since the regime change. The y-axis shows the year-on-year change in monthly trading volume (2026 vs 2025), split by asset type, for the FCA and ESMA regimes. Source: MarketAxess TraX.
UK linkers: the £5m line
UK inflation-linked gilts, or linkers, stand out as an example of the drift towards larger government tickets.
Linkers are more sensitive to trading conditions than traditional gilts, and the FCA regime includes specific provisions for them, including a £5 million deferral threshold. TraX data shows the share of linker trades between £2 million and £5 million falling in 2026, whilst the share above £5 million rose. There was little change at the lowest (£1 million to £2 million) and highest (£10 million and above) ends of this range.
The main movement occurred in the range just below the threshold, exactly where you’d expect if participants were sizing trades to clear the line. Transparency thresholds appear to be shaping behaviour.
FCA UK Linker trade-size distribution
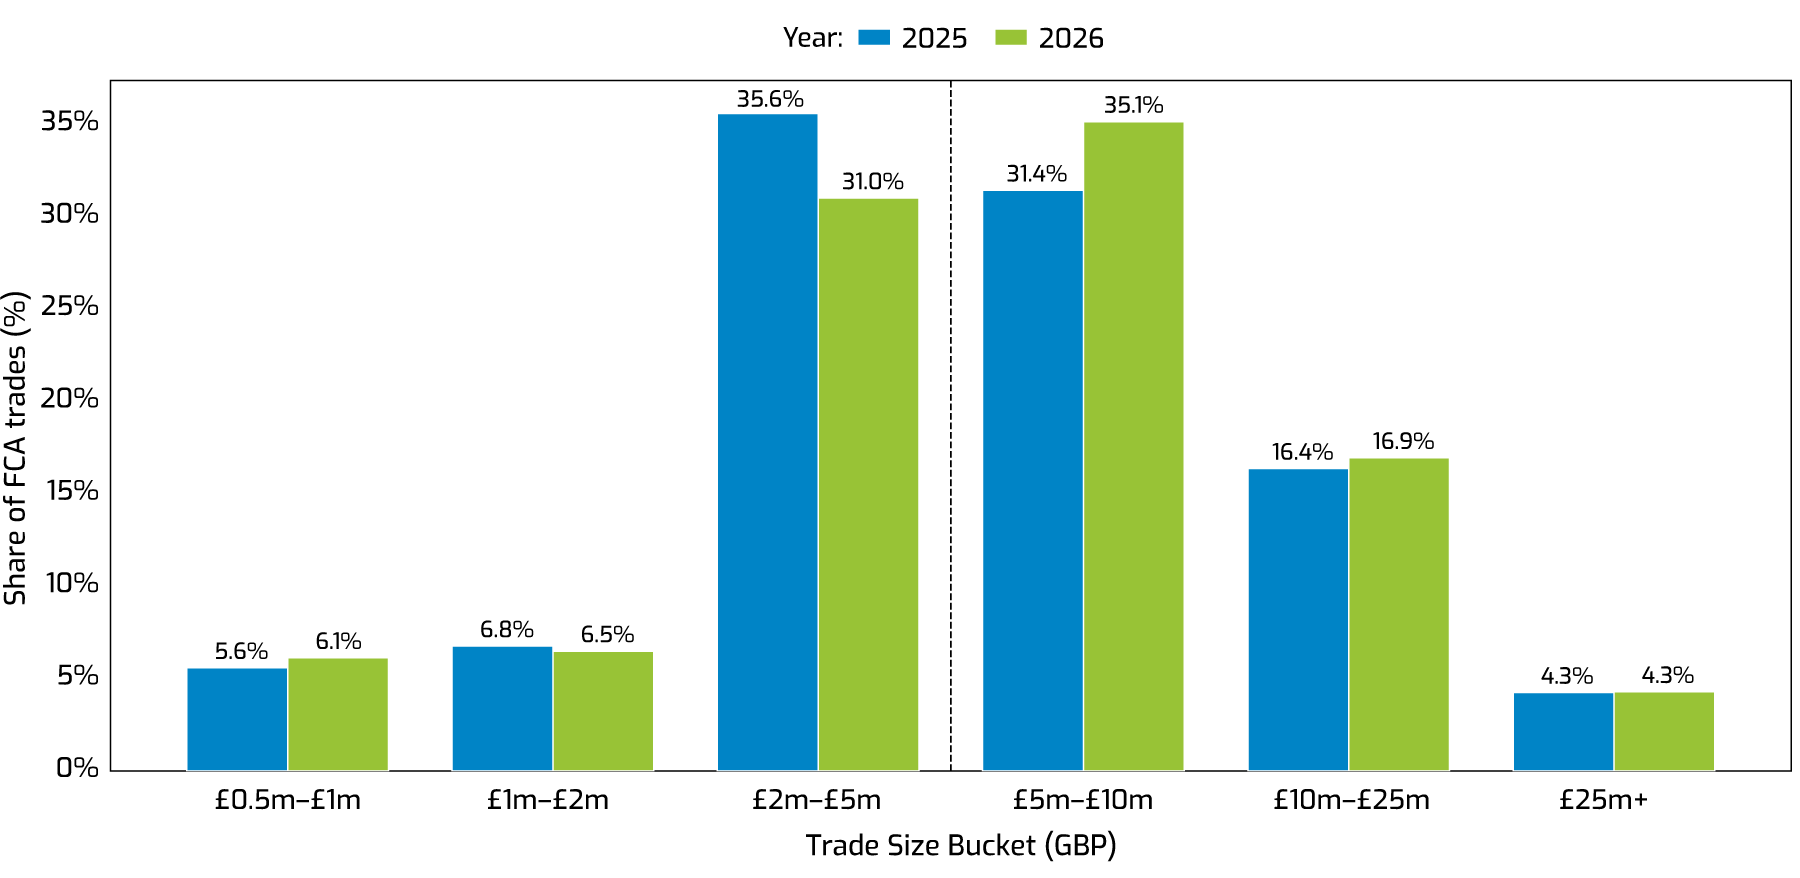
The x-axis shows trade-size buckets in GBP around the FCA transparency thresholds, including the £5 million threshold for inflation-linked gilts. The y-axis shows each bucket's share of total trade count, 2025 vs 2026. Source: MarketAxess TraX.
Who is behind the trades?
Public regulatory data doesn’t answer the question of who is behind the changes. TraX allows this through giving direction and counterparty insights, alongside a cleansed regulatory feed.
This view has shown a clear split. The buy-side increased its market share of volume in both corporate investment grade and high yield, while banks and dealers moved the other way. Interdealer brokers shifted away from investment grade and towards high yield.
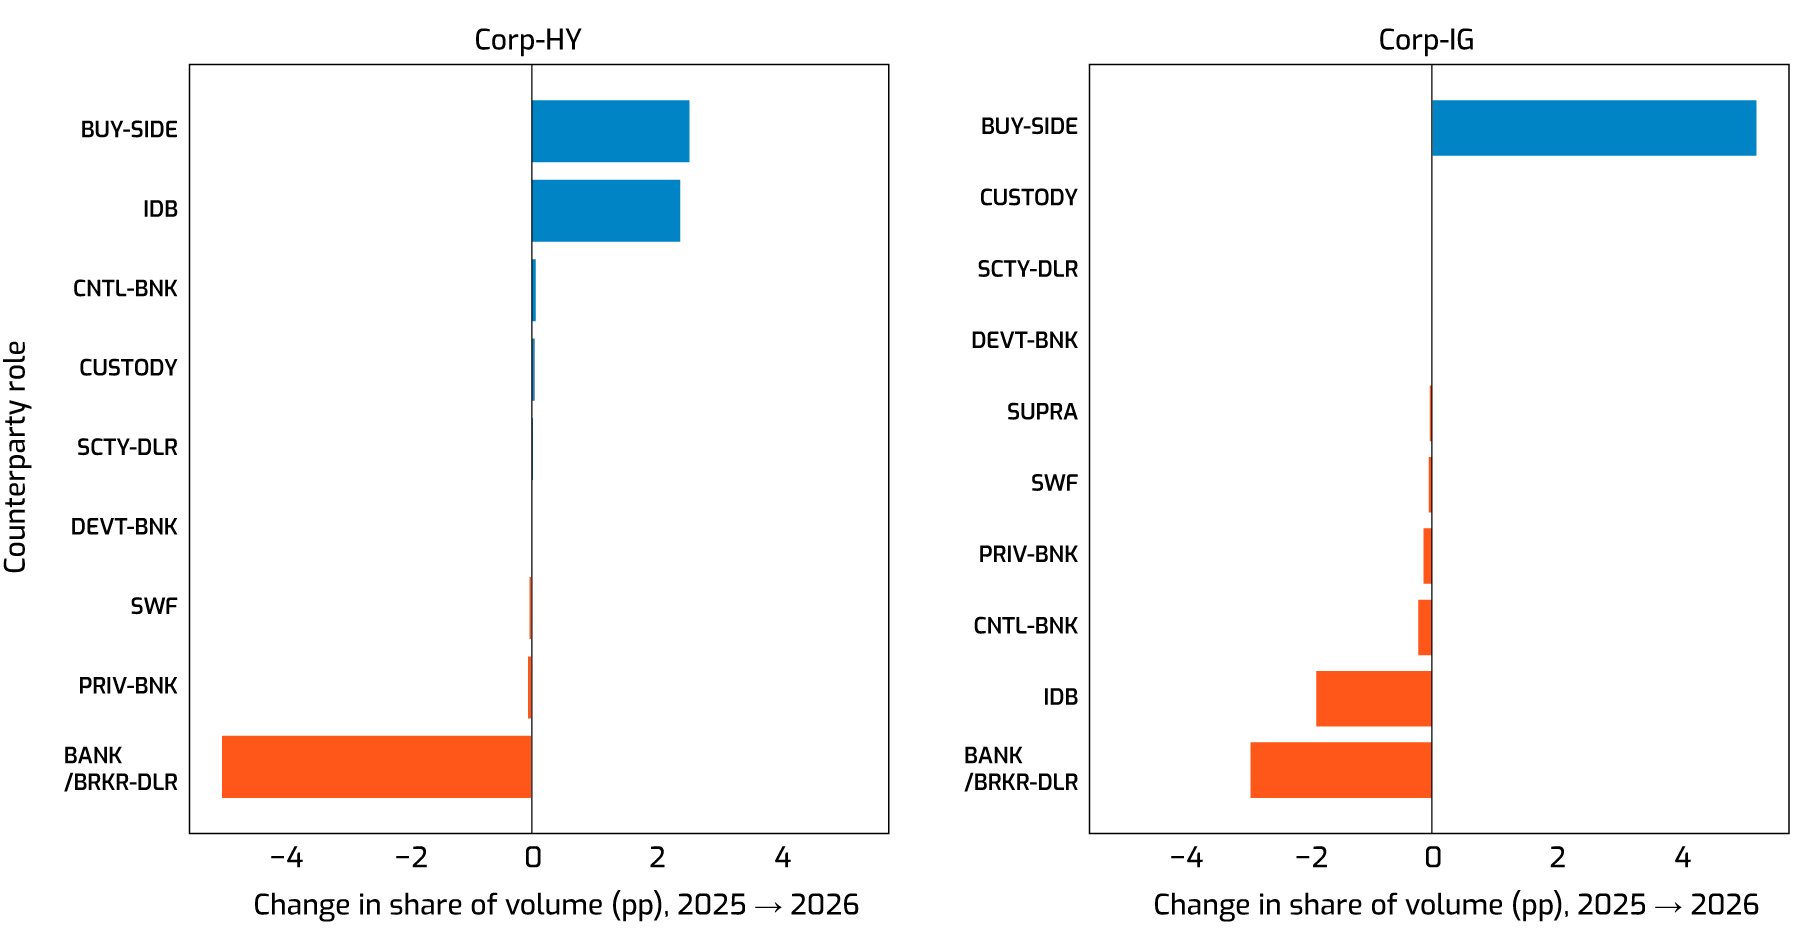
The chart shows the percentage-point change in share of traded volume (2026 vs 2025) by counterparty role, for corporate high yield and corporate investment grade. Source: MarketAxess TraX.
Turning transparency data into market insight
The transparency reforms have created more information about bond market activity. However, in order to generate meaningful insights, the data needs to be a clean, consolidated view with direction and context attached.
That’s what TraX Tape provides. Clients see the regulatory post-trade feed cleansed and normalised, next to TraX insight on direction and counterparty type that public data doesn’t capture.
We expect more change ahead, as participants continue to adjust to increased visibility. Behaviour around thresholds is likely to become more pronounced. The planned go-live of the ESMA bond consolidation tape in Q1 of 2027 should be another catalyst. TraX Tape will continue to bring these new datasets into a single source of decision-grade data giving clients visibility on how the market is adapting as it happens.