
AxessPoint: Block trade insights using the TRACE uncapped data set

Highlights
- Uncapped TRACE data brings complete transparency for the largest and most important market segment: block trades.
- Uncapped trade sizes are critical for understanding price context and risk transfer, since trade sizes can range from $5 million to as high as several hundred million.
Capped trades obscure block trading patterns
FINRA “caps” the TRACE-disseminated trade quantities over a certain threshold, allowing the participants some reduction in information leakage. For trades over $5mm in US Investment Grade and $1mm in US High Yield, FINRA reports only that the trade has met the size threshold. FINRA also reports the average capped volume for that product at end of day.
Historically, FINRA would make the uncapped trade quantities available with a lag of 18 months, but in late 2017, they reduced that lag to two quarters. This change allows for more timely access to valuable market data.
The main value in the data set is the transparency in trading patterns that it provides. Although only 5.5% of all trades by count in 2019 were capped, over 57% of corporate trades by volume were capped over the course of the year. When we dig into the data, it’s clear that the trading patterns vary greatly from the averages of $11MM (IG) and $3.5MM (HY).
CAPPED AND UNCAPPED MARKET VOLUME BY TRADE SIZE 2019 (USD billions)
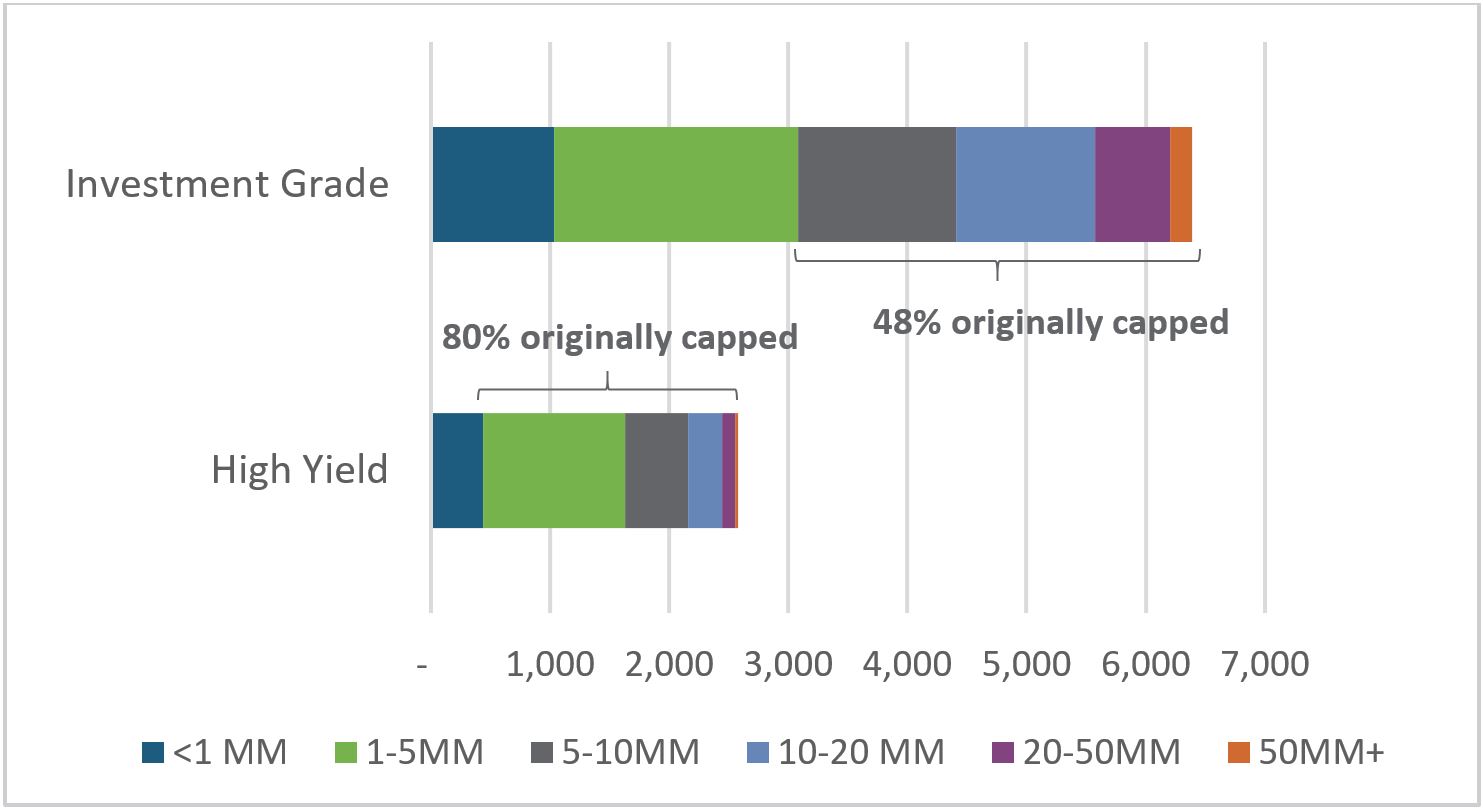
While the average volume of those trades is helpful for a large-scale view, the usefulness diminishes rapidly in constructing detailed analysis across issuers, sectors, and maturities. In 2019, there were nearly 3,000 trades over $50MM in size, totaling greater than $200B in volume. Roughly 1/3 of IG capped trades were over $10MM, and 25% of all IG capped volume were trades of $20MM or larger.
A look into high yield capped trades
In 2019, 80% of all High Yield volume was originally capped. Additionally, FINRA’s capped set also neglects the trading pattern of bonds that haven’t gone through the grading process. Issuers with solid credit standing occasionally opt to forego the efforts to get an individual bond graded. This can cause a vast discrepancy between available data and true activity. There were 131,000 “High Yield” trades in 2019 that were capped and had true quantities between $1 and $5MM, meaning they wouldn’t have been capped if graded differently. This equates to over $300 billion in volume that could be misinterpreted. In aggregate, this can cause misinformation about the true size of the investment grade and high yield markets.
The importance of complete data
Particularly in current market conditions, data is a premium resource. Firms that can take advantage of available information and tools at their disposal are best poised for success. The uncapped data set reveals the full depth of the market and valuable trends that can be leveraged for more accurate forecasting.
Uncapped TRACE from MarketAxess
Using an intelligent mapping engine, the uncapped TRACE report has been linked to the original trade records as an add-on to the standard Corporates and 144a feed. This provides accurate trade-level information for transactions that were previously capped, going all the way back to the inception of the feed in July 2002.
For questions or follow-up, email our data scientists at research@marketaxess.com