
AxessPoint: Examining liquidity spikes at month-end

-
Trading volumes on month-end days nearly double compared to the rest of the month in US High Grade and High Yield.
-
Trading activity is increasingly concentrated near the end of the day, especially at month-end.
- On MarketAxess, volume for Auto-X™ and Portfolio Trading on month-end are consistently more than double the ADV in these protocols, especially in High Grade.
Trading volumes nearly double on month-end days
An analysis of TRACE data in US High Grade and High Yield shows that more volume is traded on month-end now versus a decade ago. Increasing trading activity could lead to better liquidity and execution during month-end, especially towards the end of the trading day. This trend is indicative of changing bond market microstructure and trading patterns, and the activity spike is also reflected in newer trading engagements that look to promote efficiency of execution.
First, we looked at the annual average month-end volume as a multiple of the same month’s average daily volume (ADV) for both High Grade and High Yield from 2008 to date*. For each month, we calculate the following:
Historical month-end multiple of ADV
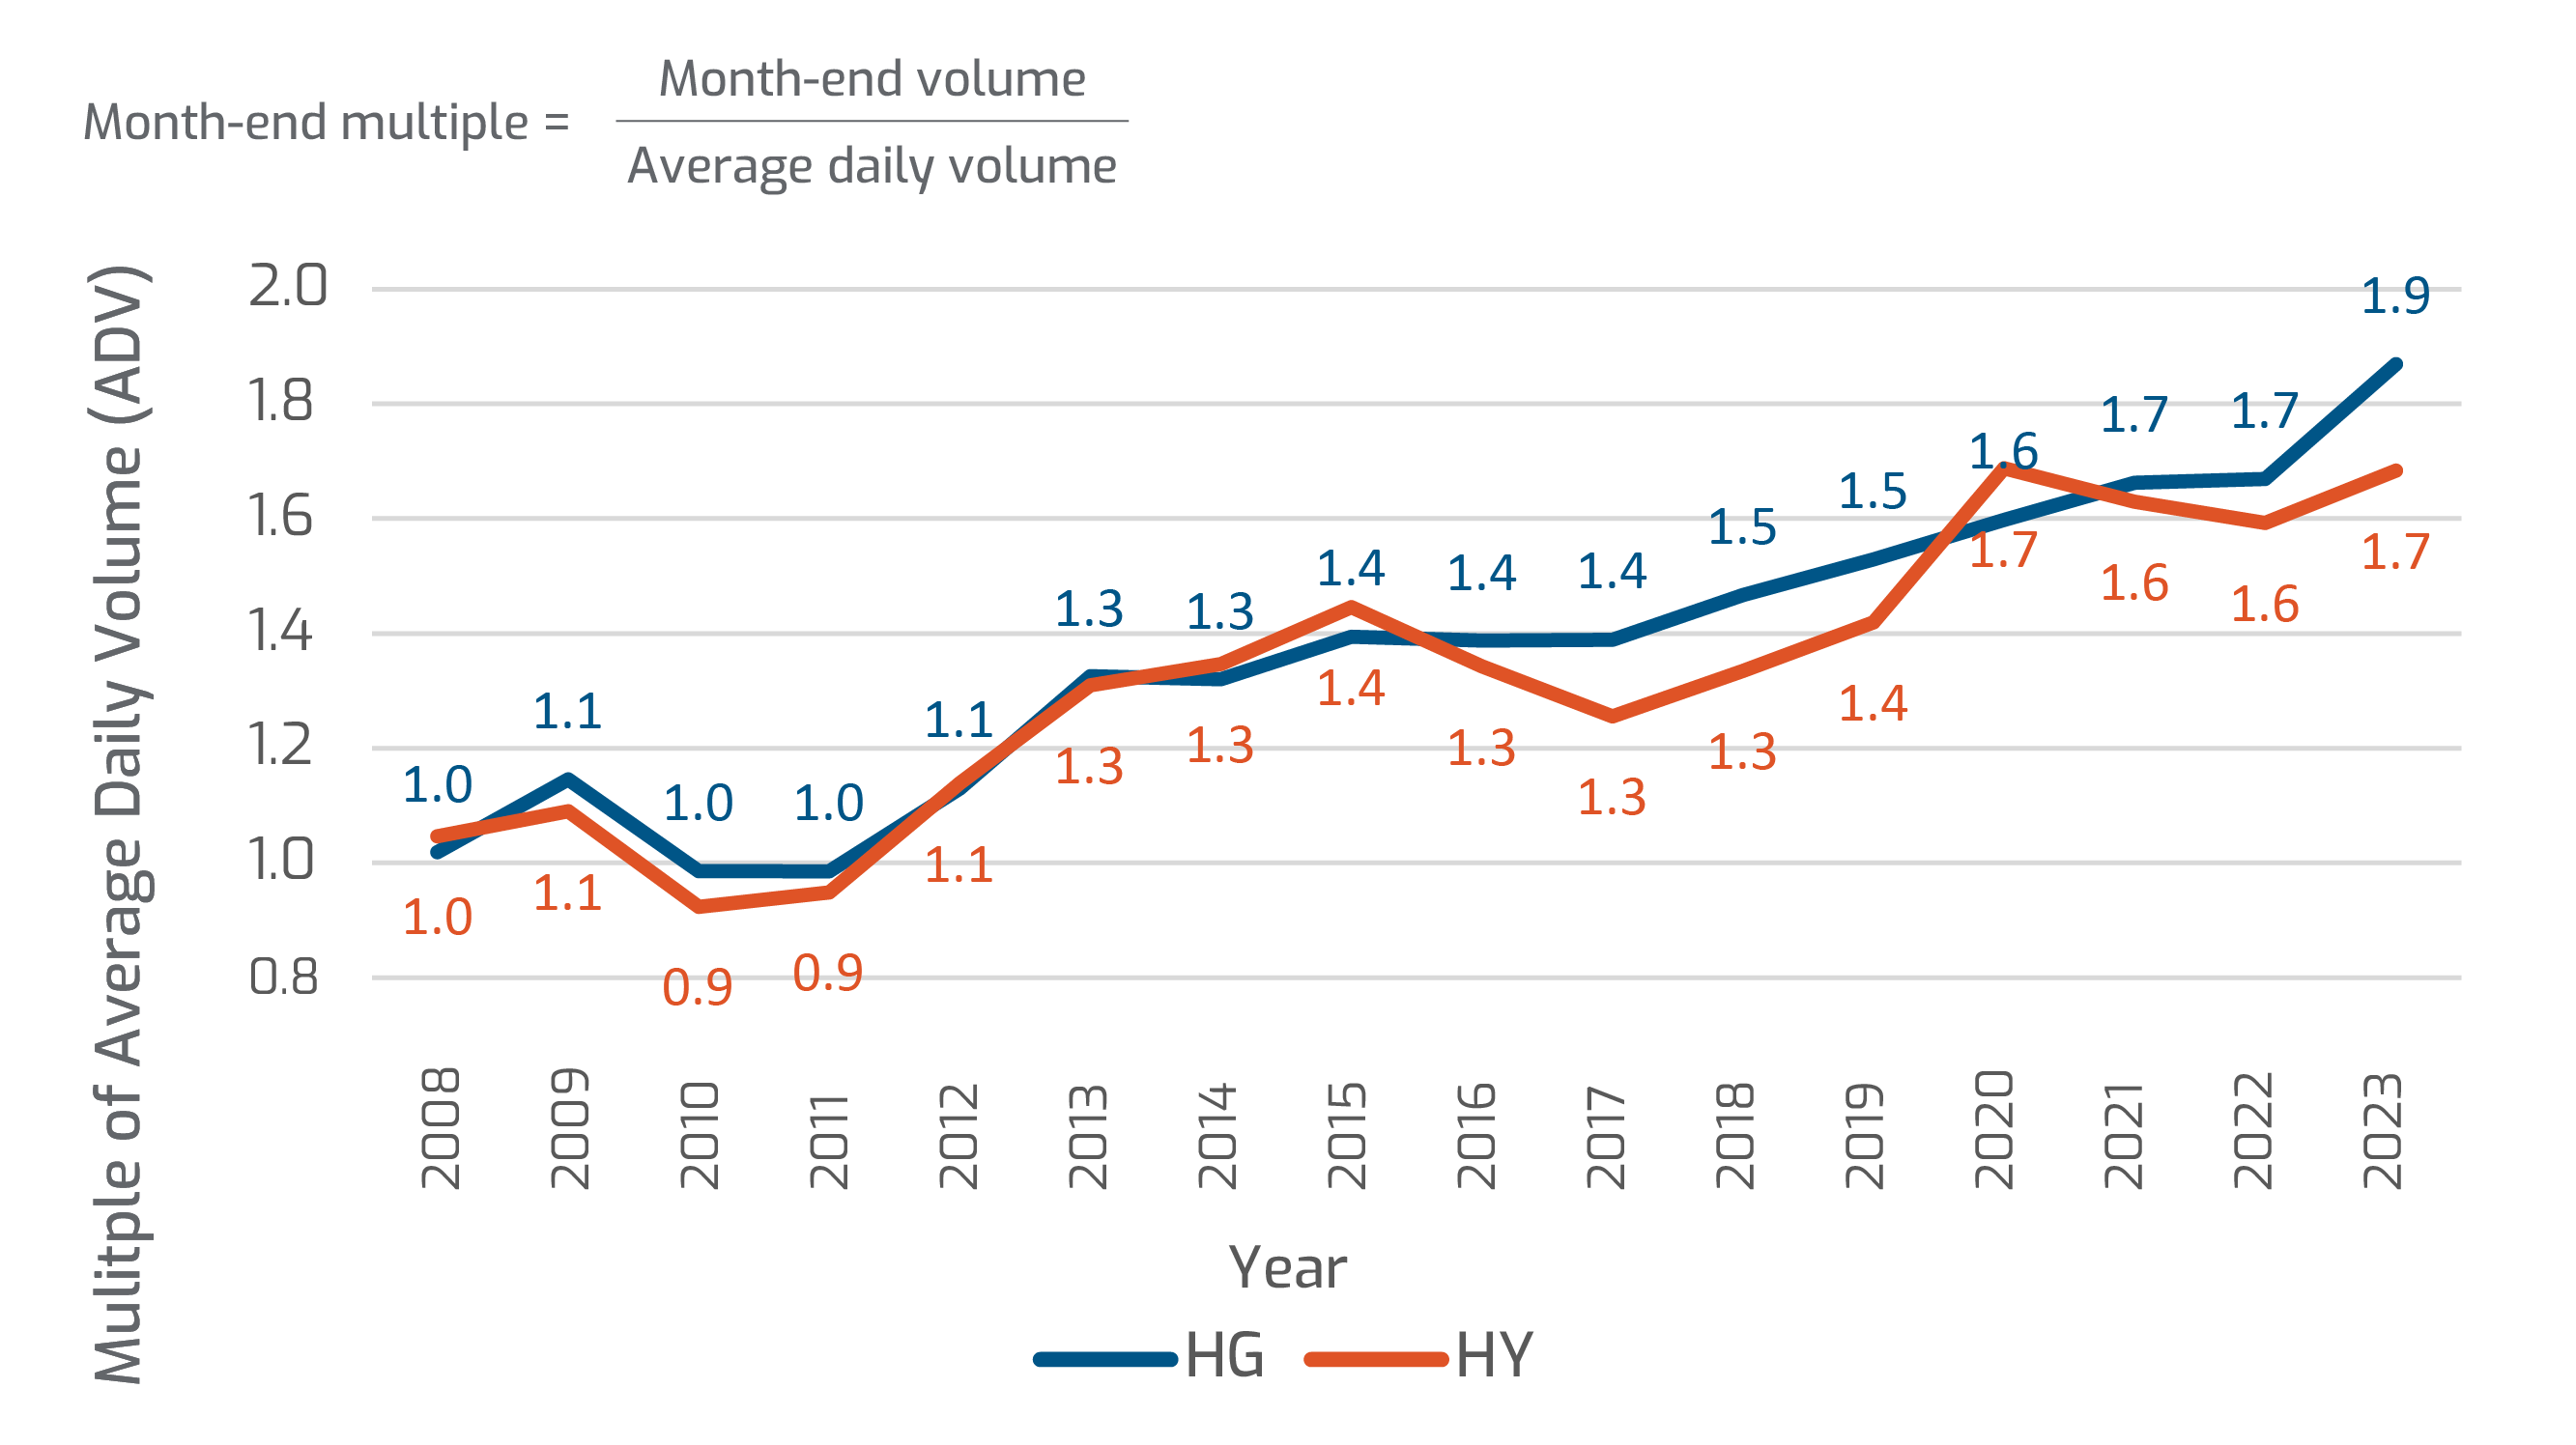
As can be seen in the chart above, both groups showed an upward trajectory in trading volume. High Grade increased from 1x ADV in 2008 to 1.9x ADV in 2022, while High Yield increased by a similar magnitude from 1x ADV to 1.7x ADV in the same period.
Considering causes of activity spikes
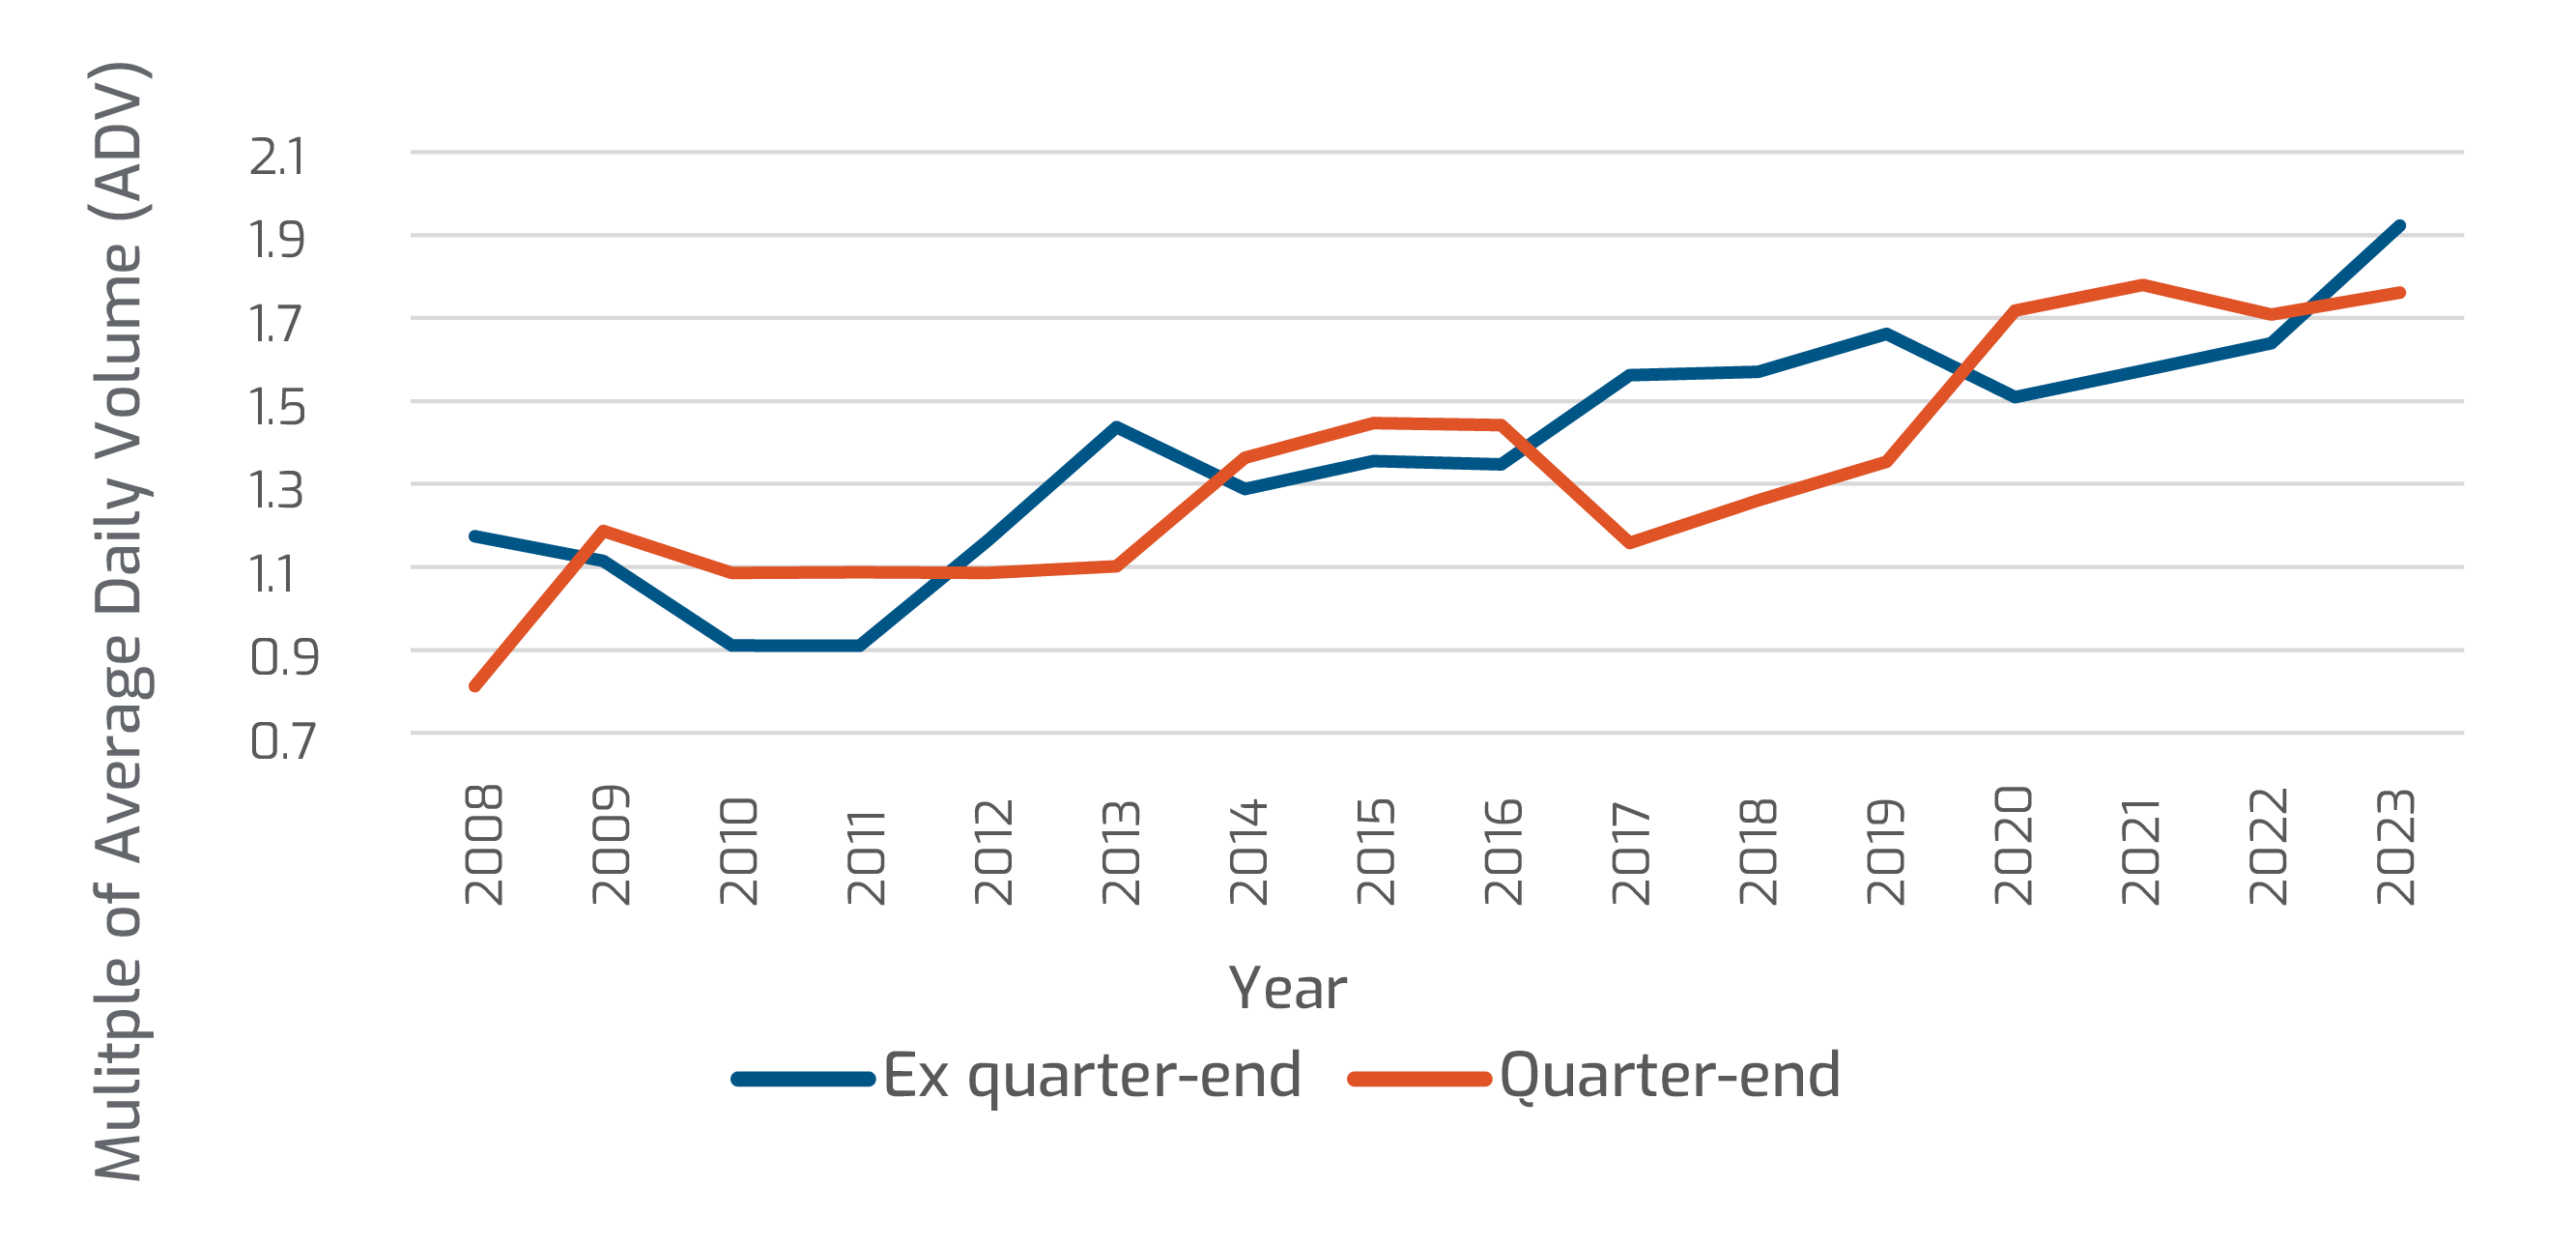
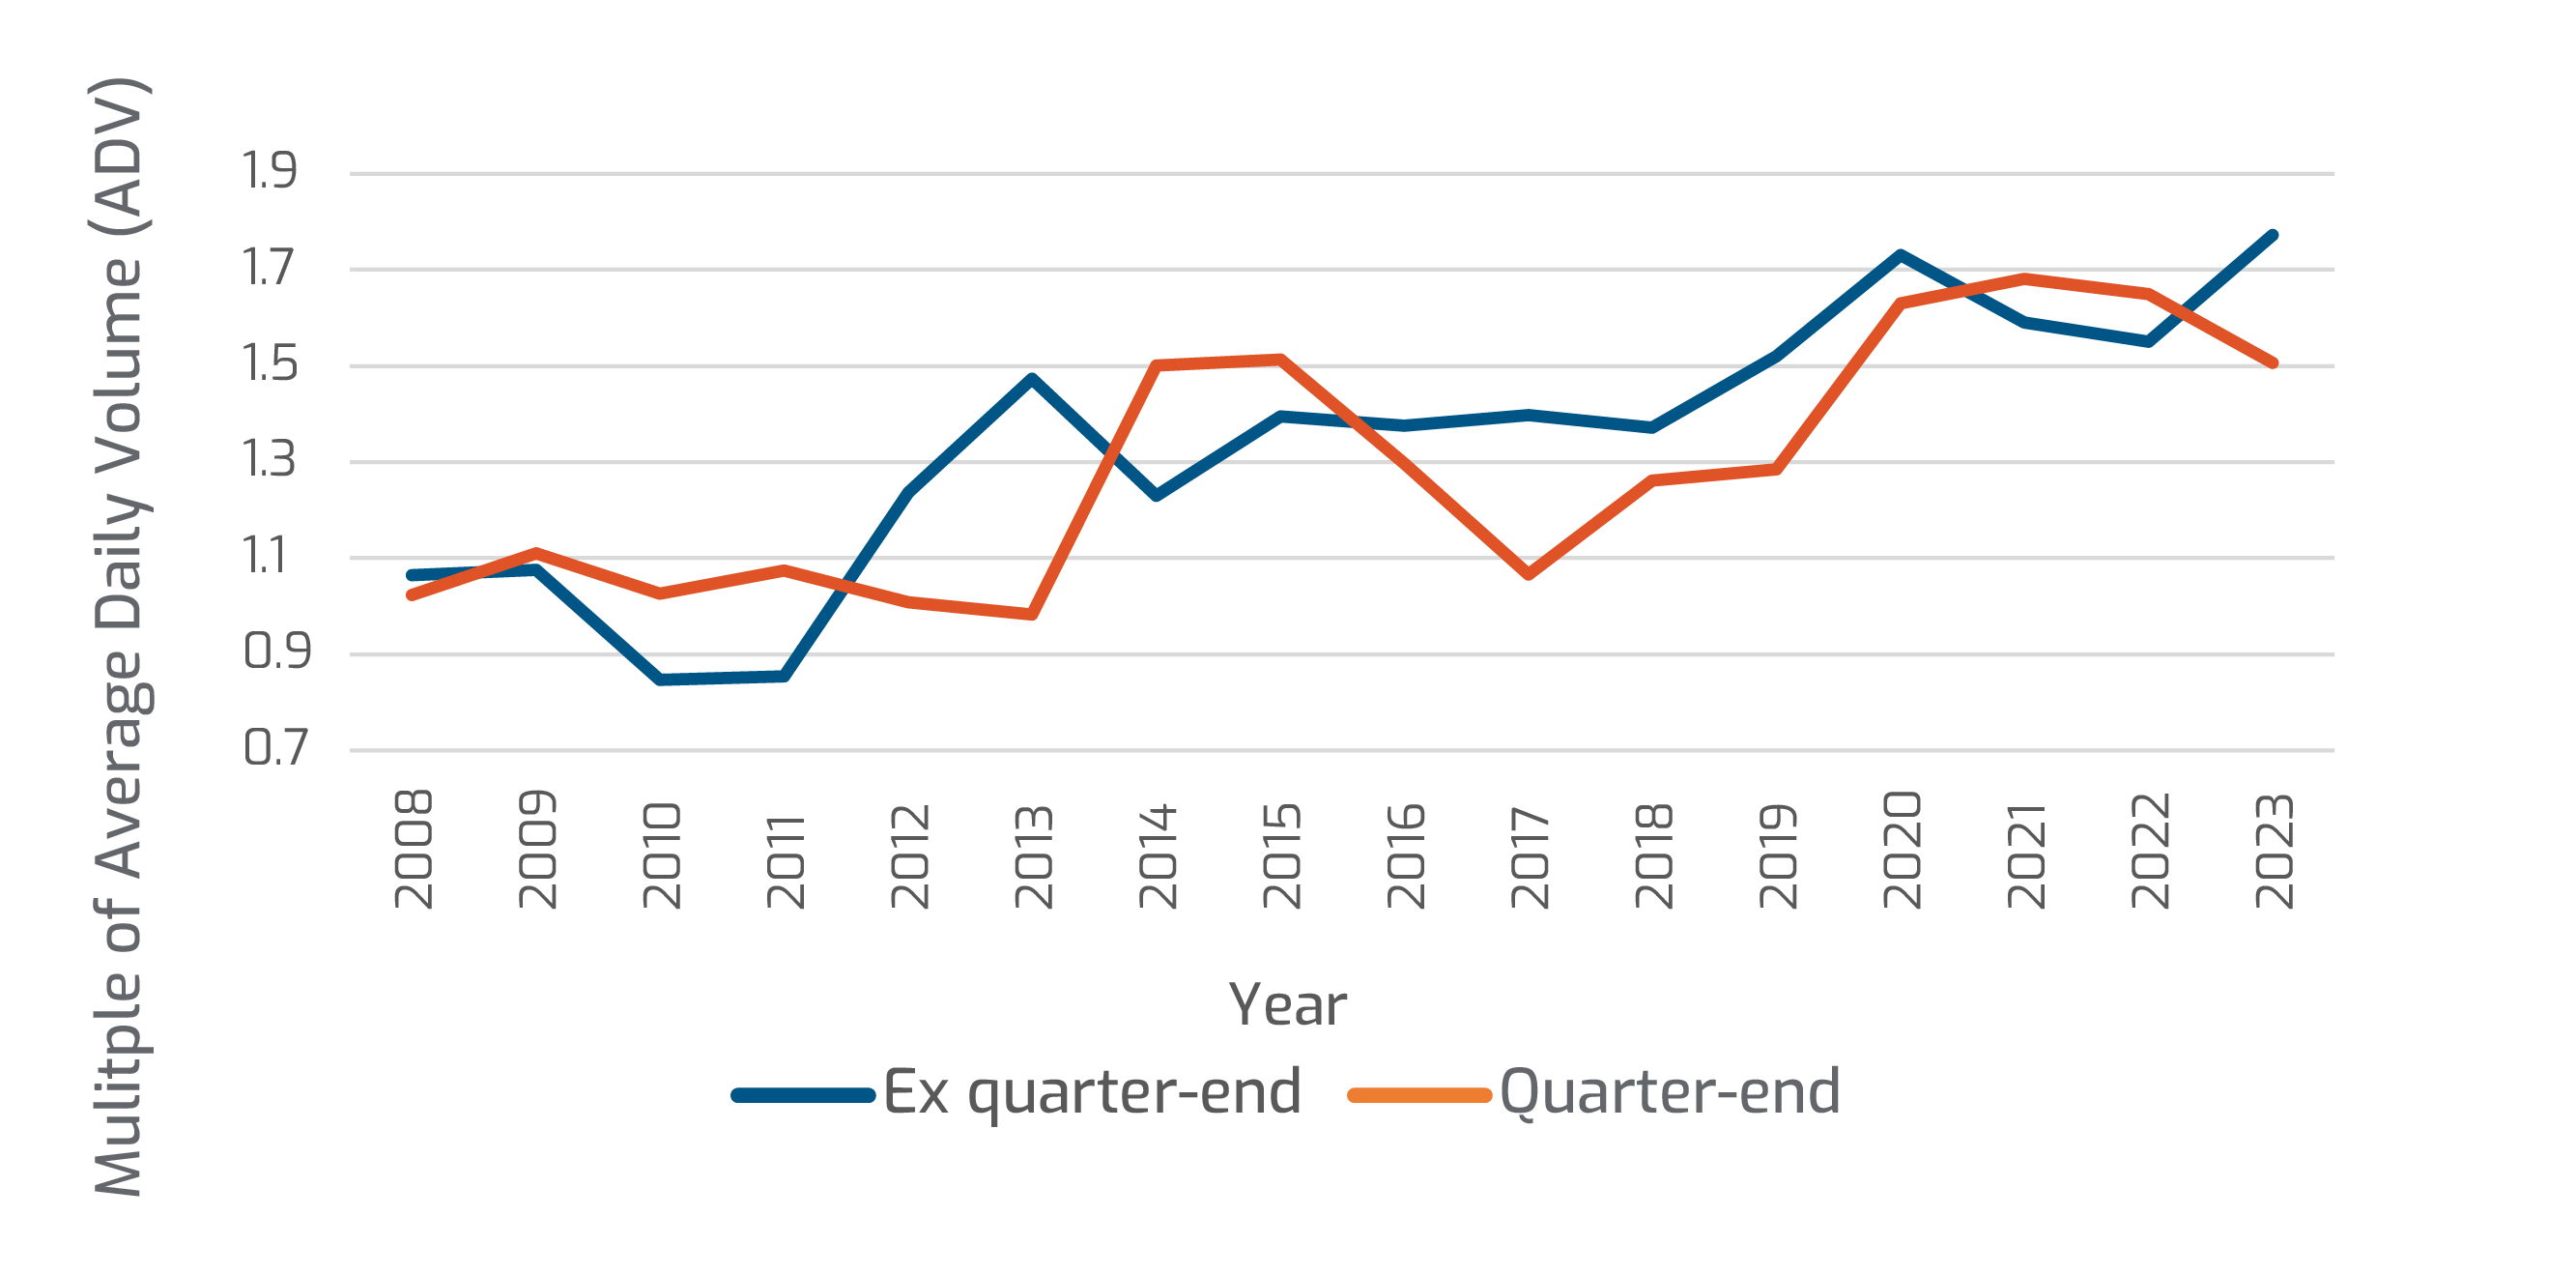
On the chart below, when comparing volumes on a quarter-end versus ex quarter-end basis we observe minimal variance. This may suggest the driver is less likely to be bank dealers optimizing capital ratios, which we would expect to primarily concentrate at quarter-ends.
An alternative hypothesis is that expanded index trading and passive rebalancing at month-ends could be a factor. The consistent uptick, regardless of quarter-end, seemingly aligns with regular monthly passive inflows. As passive fixed income investing has grown, more funds now track fixed income indices and may rebalance on regimented monthly schedules.
Historical month-end volume % ADV for High Grade
Historical month-end Volume % ADV for High Yield
Larger trading share near day-end on month-end days
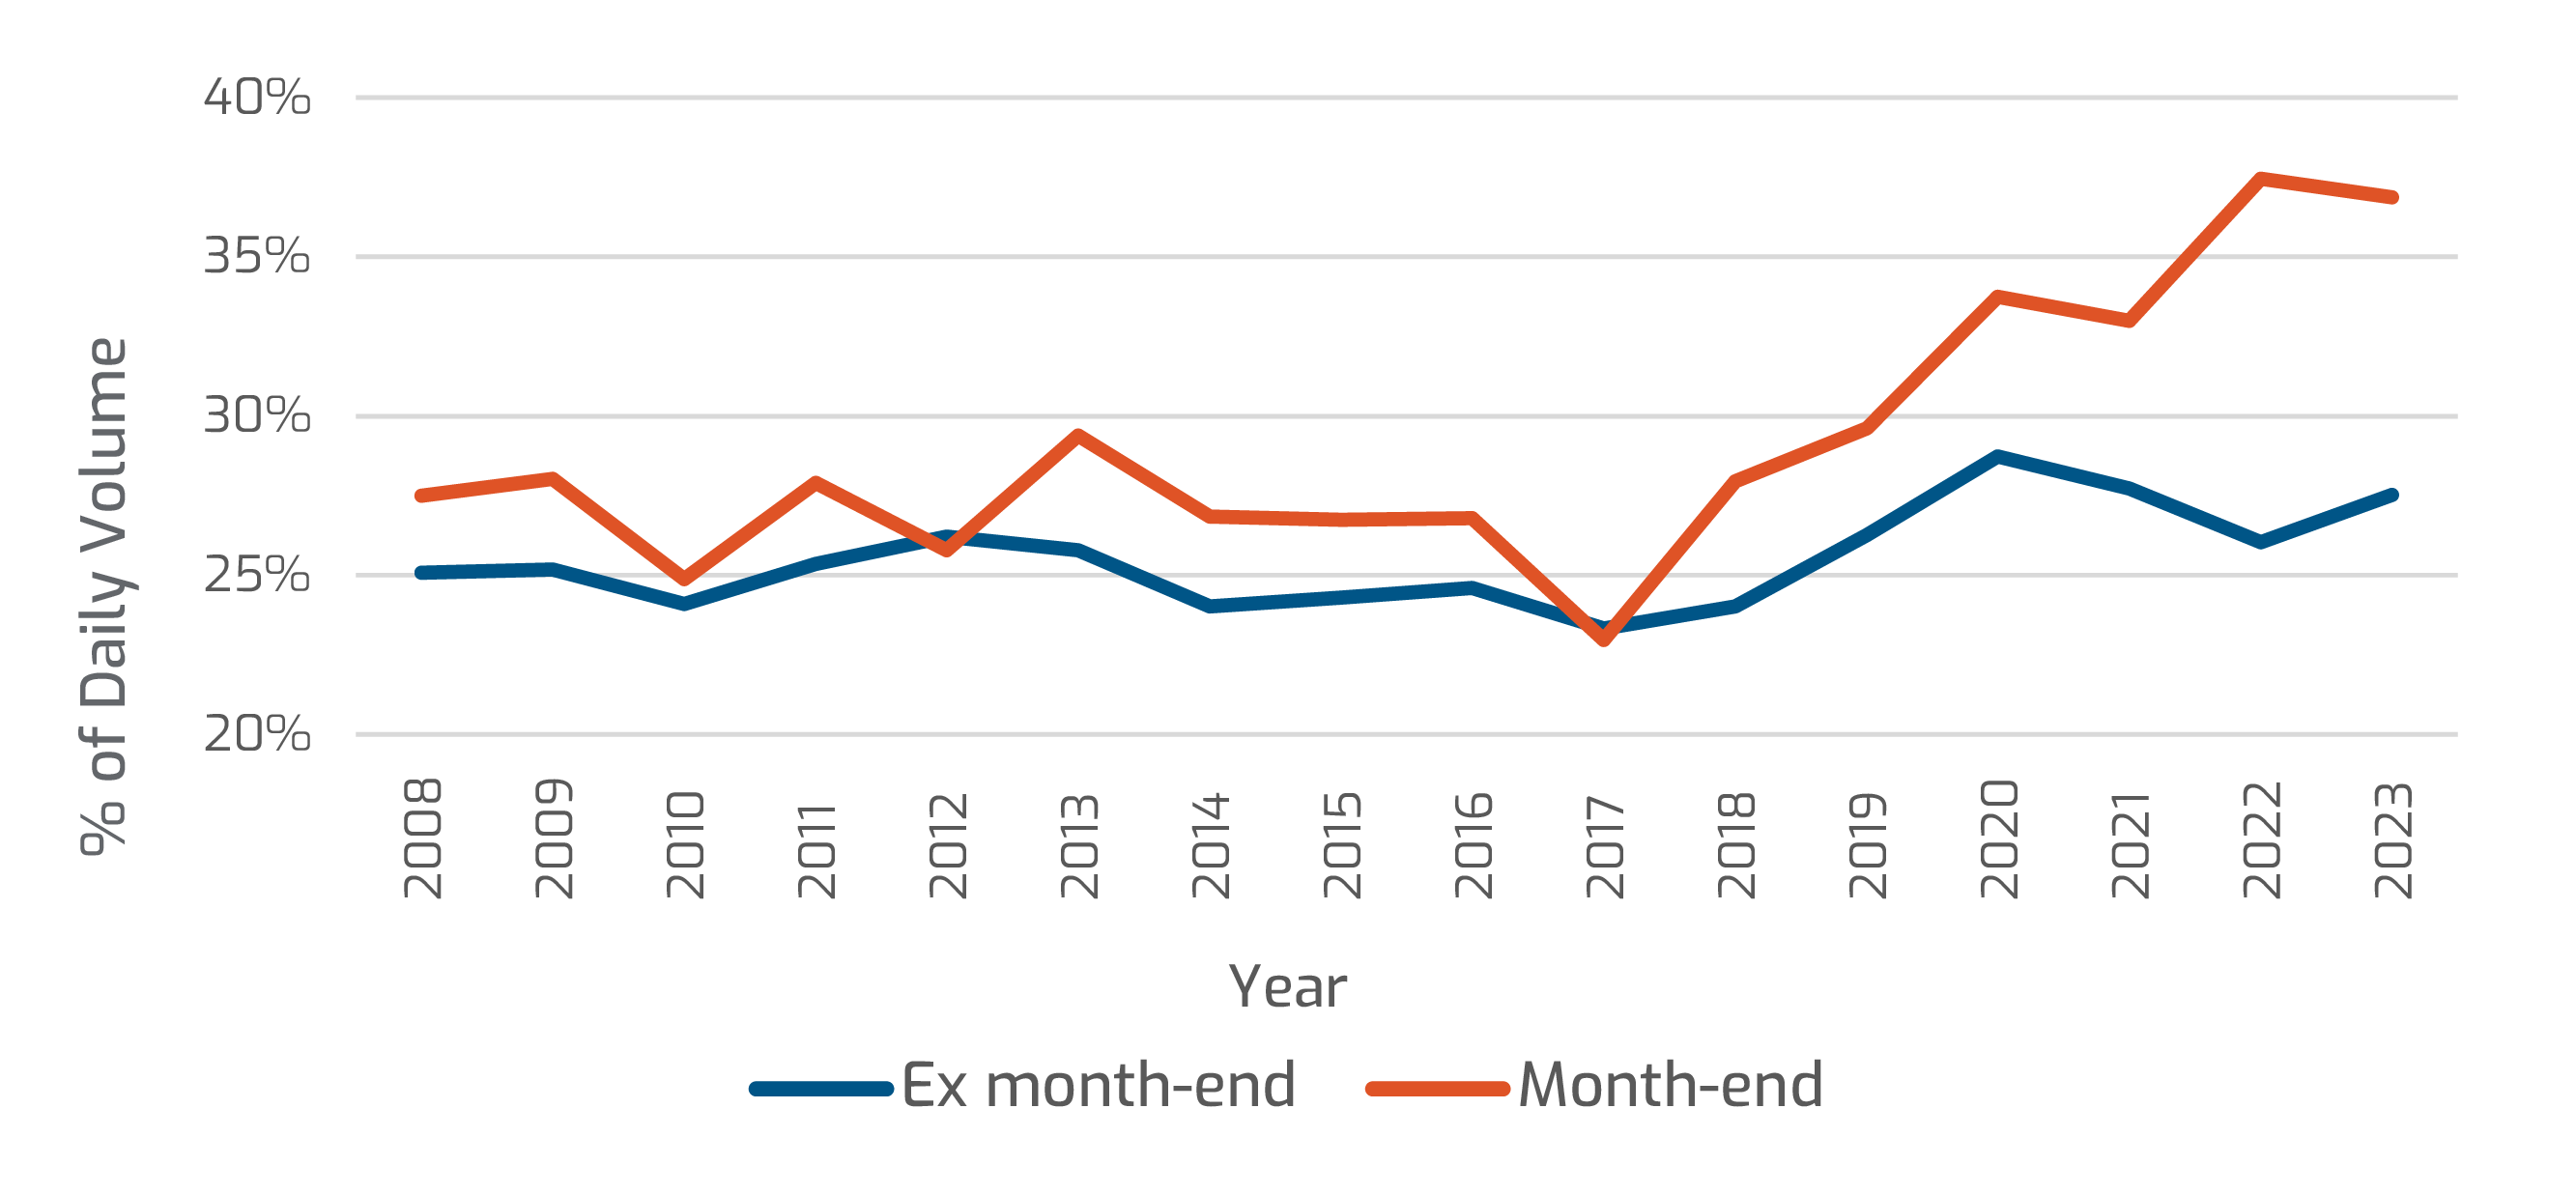
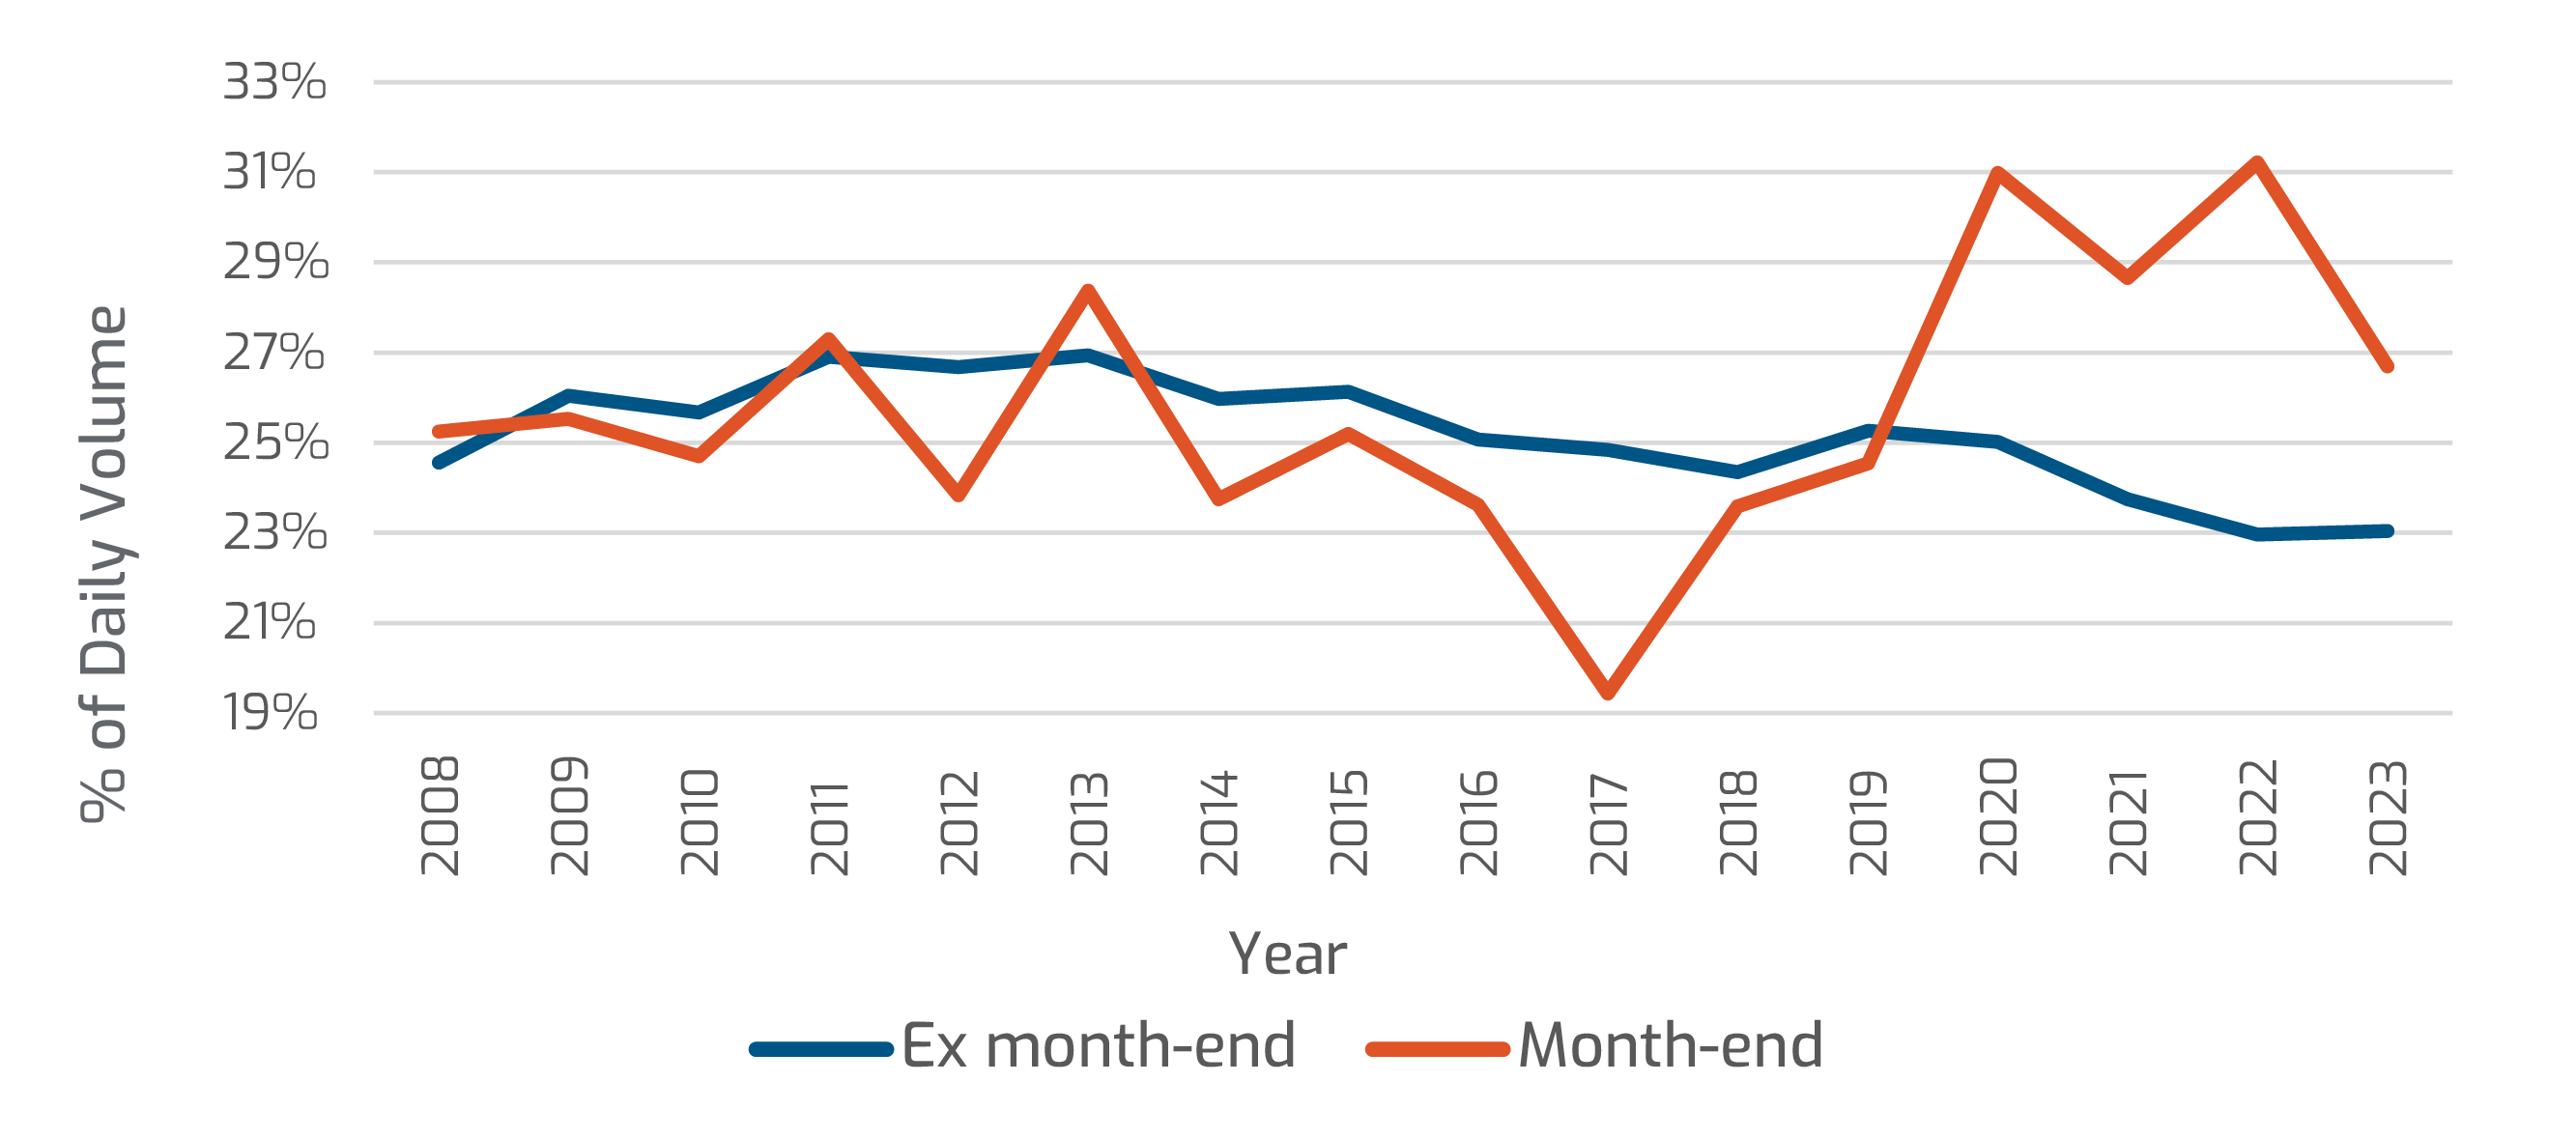
Additionally, on month-end days, we found a further concentration of liquidity occurring near the end of the trading day. The percentage of volume after 3pm on month-end days increases significantly over the years compared to after 3pm on ex month-end days.
In High Grade on month-end days, volume after 3pm as a percentage of daily volume went from ~27% in 2008 to ~36% in recent years, while on ex month-end days the trend is relatively stable at around 26%. While the same trend exists in High Yield, it was less pronounced and noisier. For month-end, it went from ~24% in 2008 to ~28% in recent years, and for ex month-end, it decreased from ~26% to ~24%, and there are some major fluctuations from 2016 to 2018.
Historical trading volume after 3pm for High Grade
Historical trading volume after 3pm for High Yield
Auto-X and Portfolio Trading
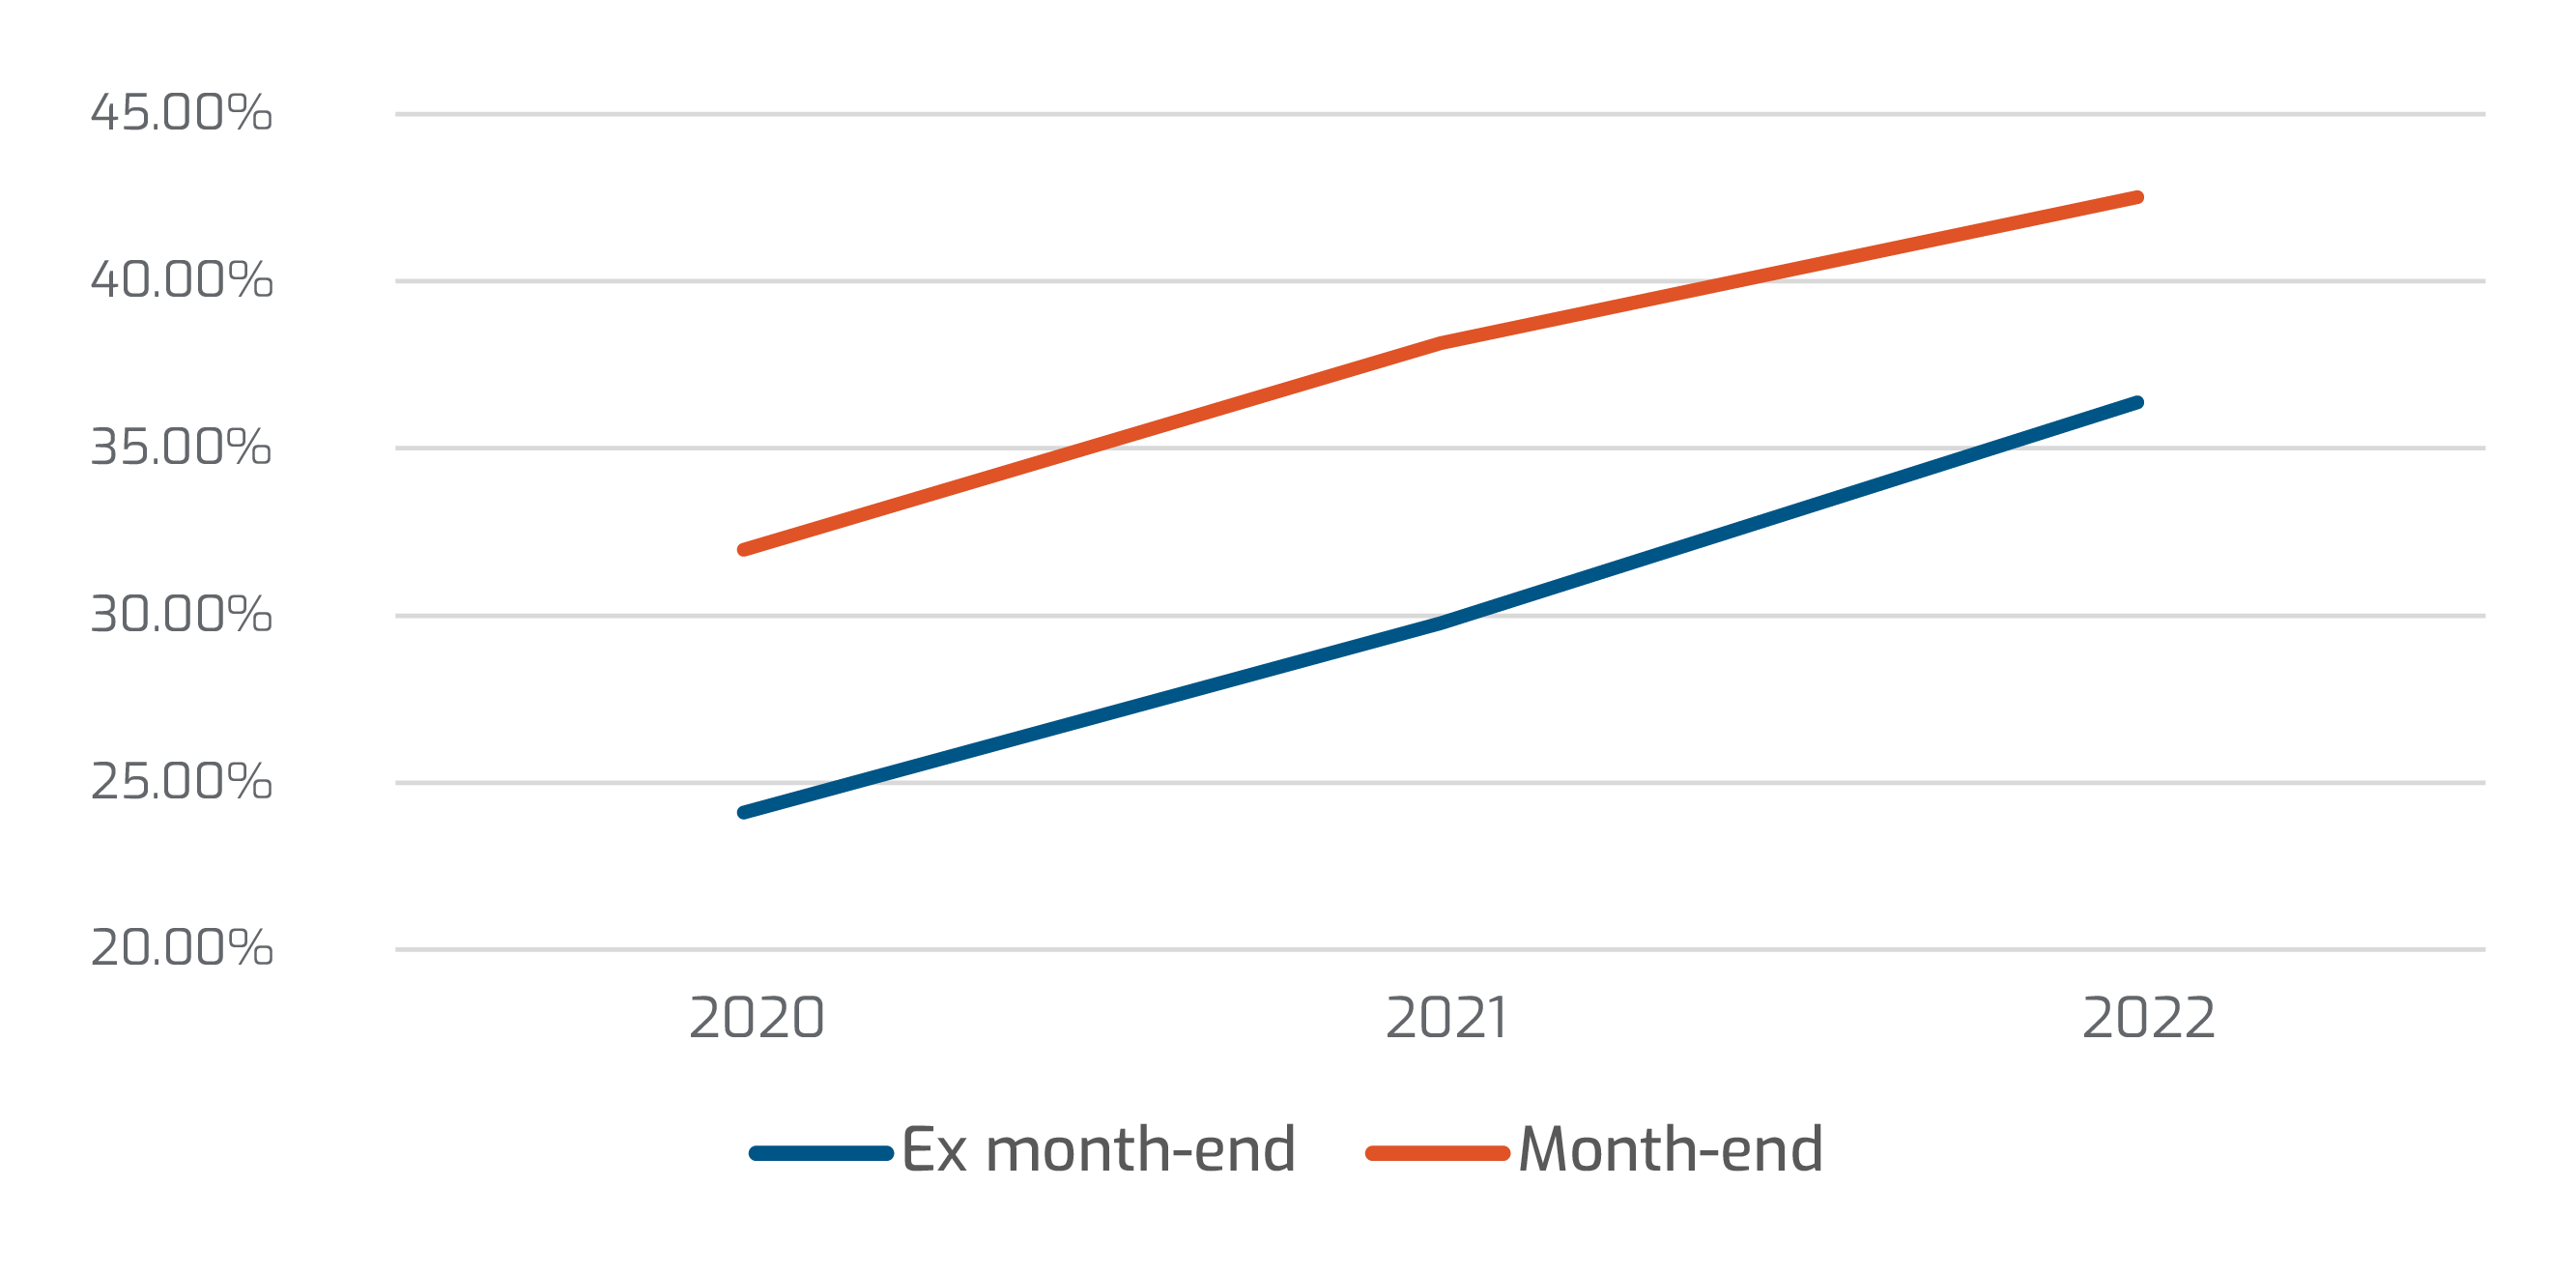
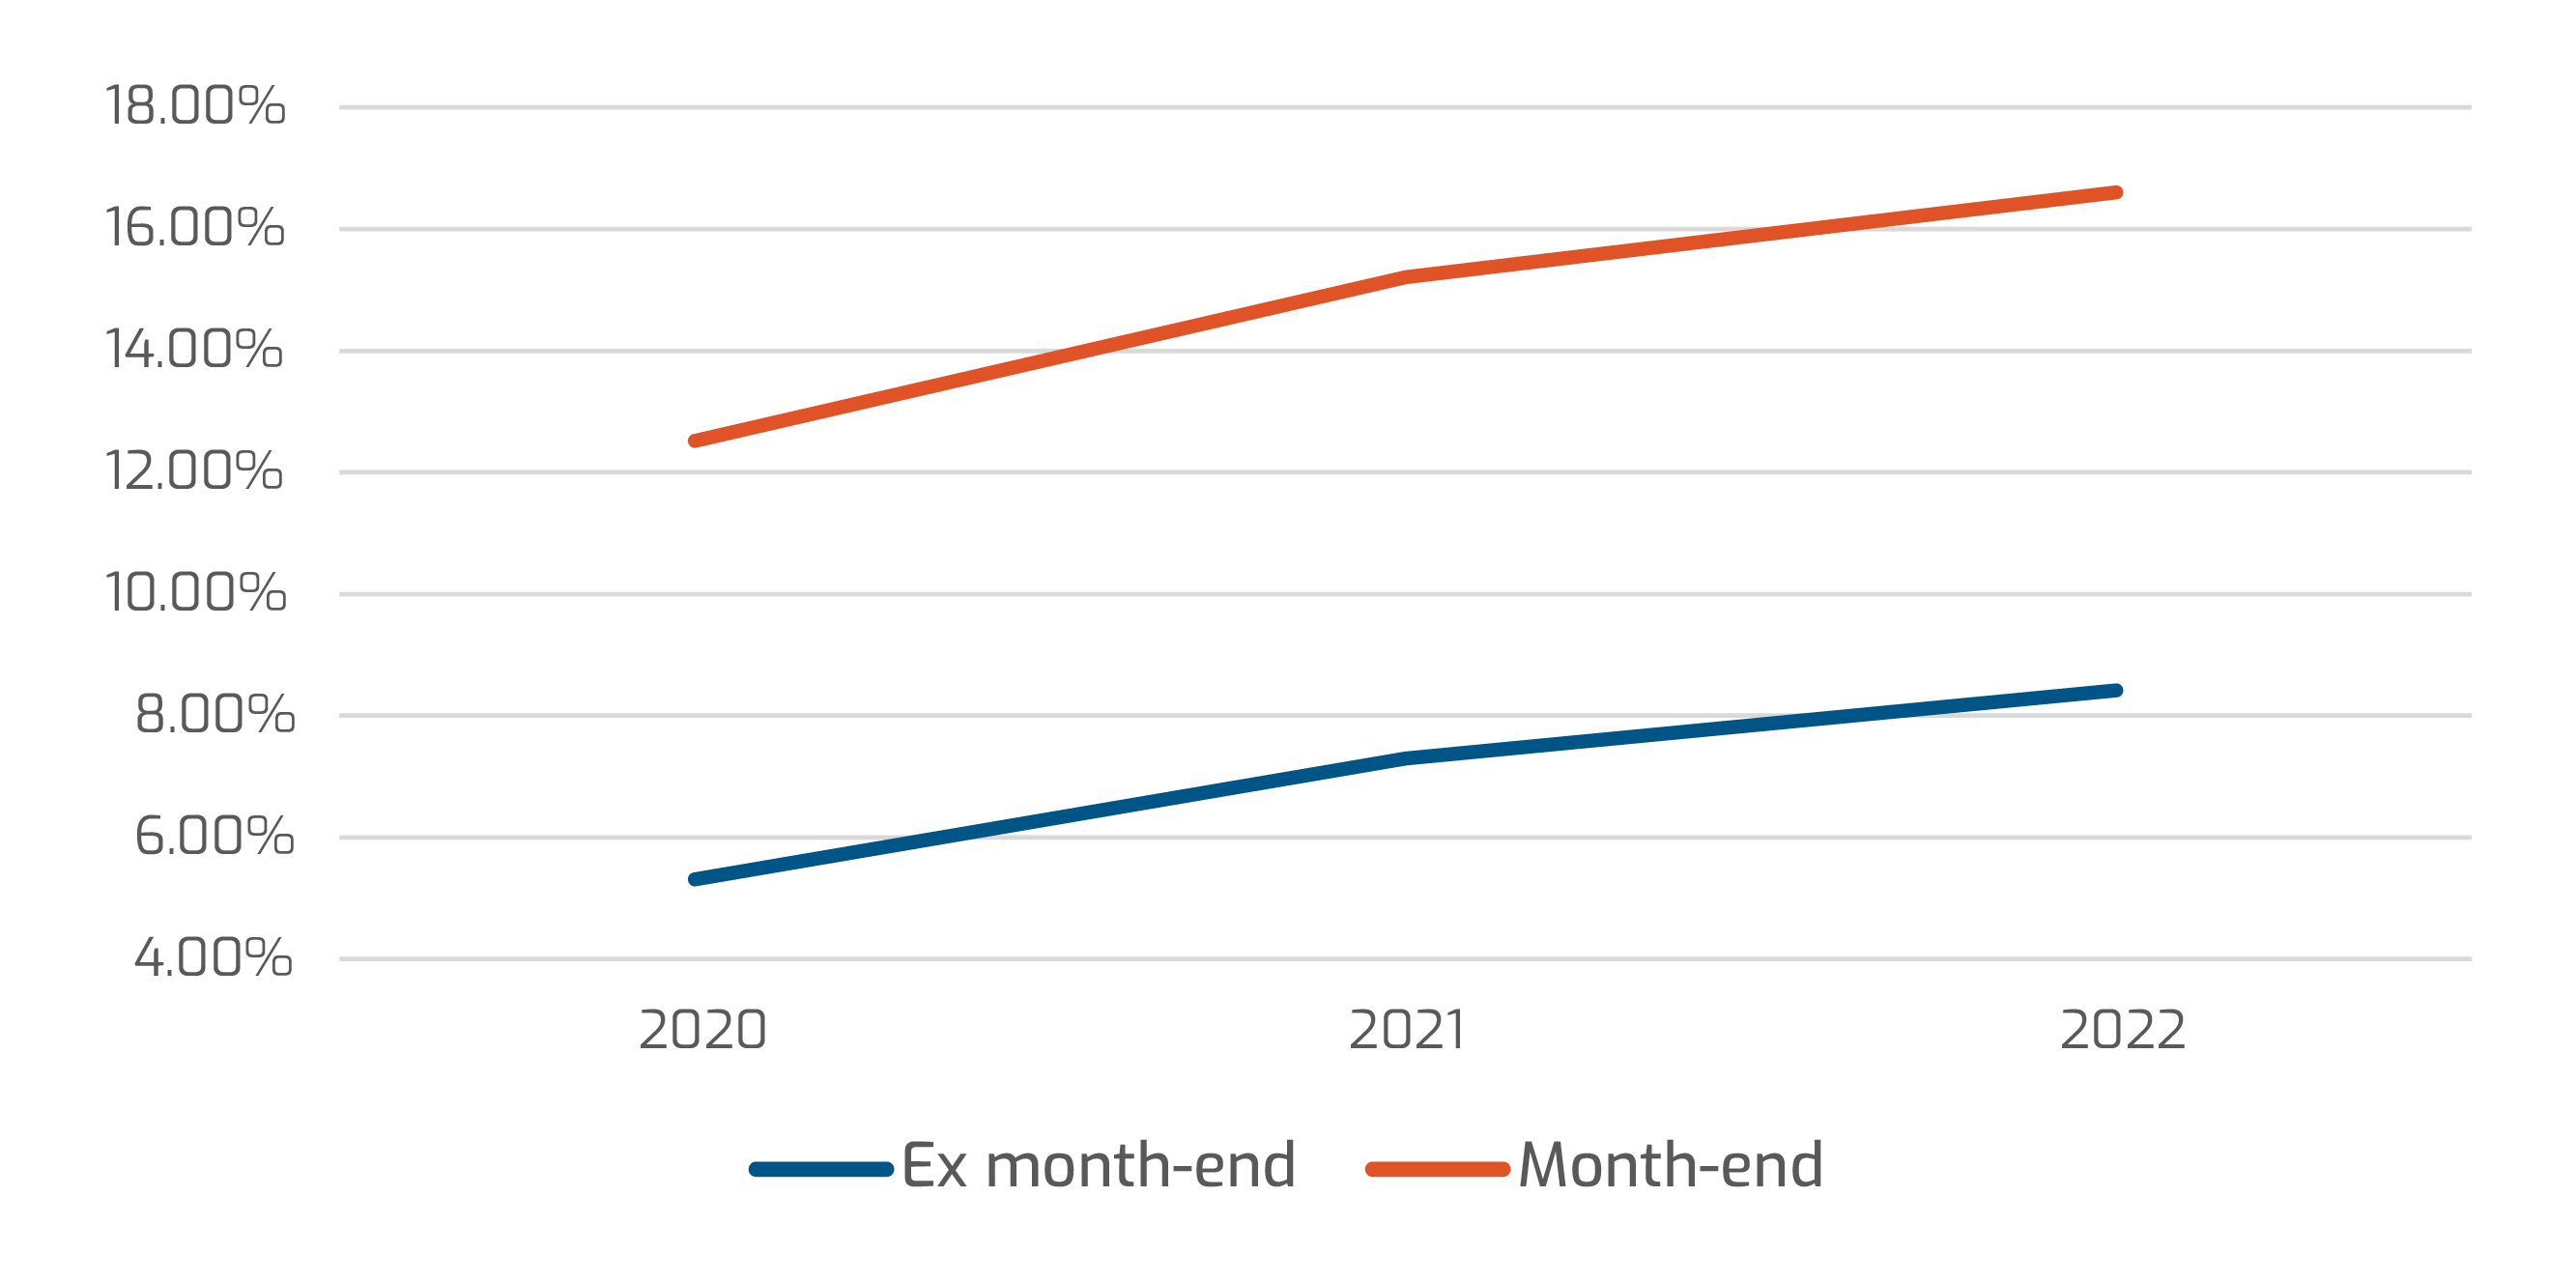
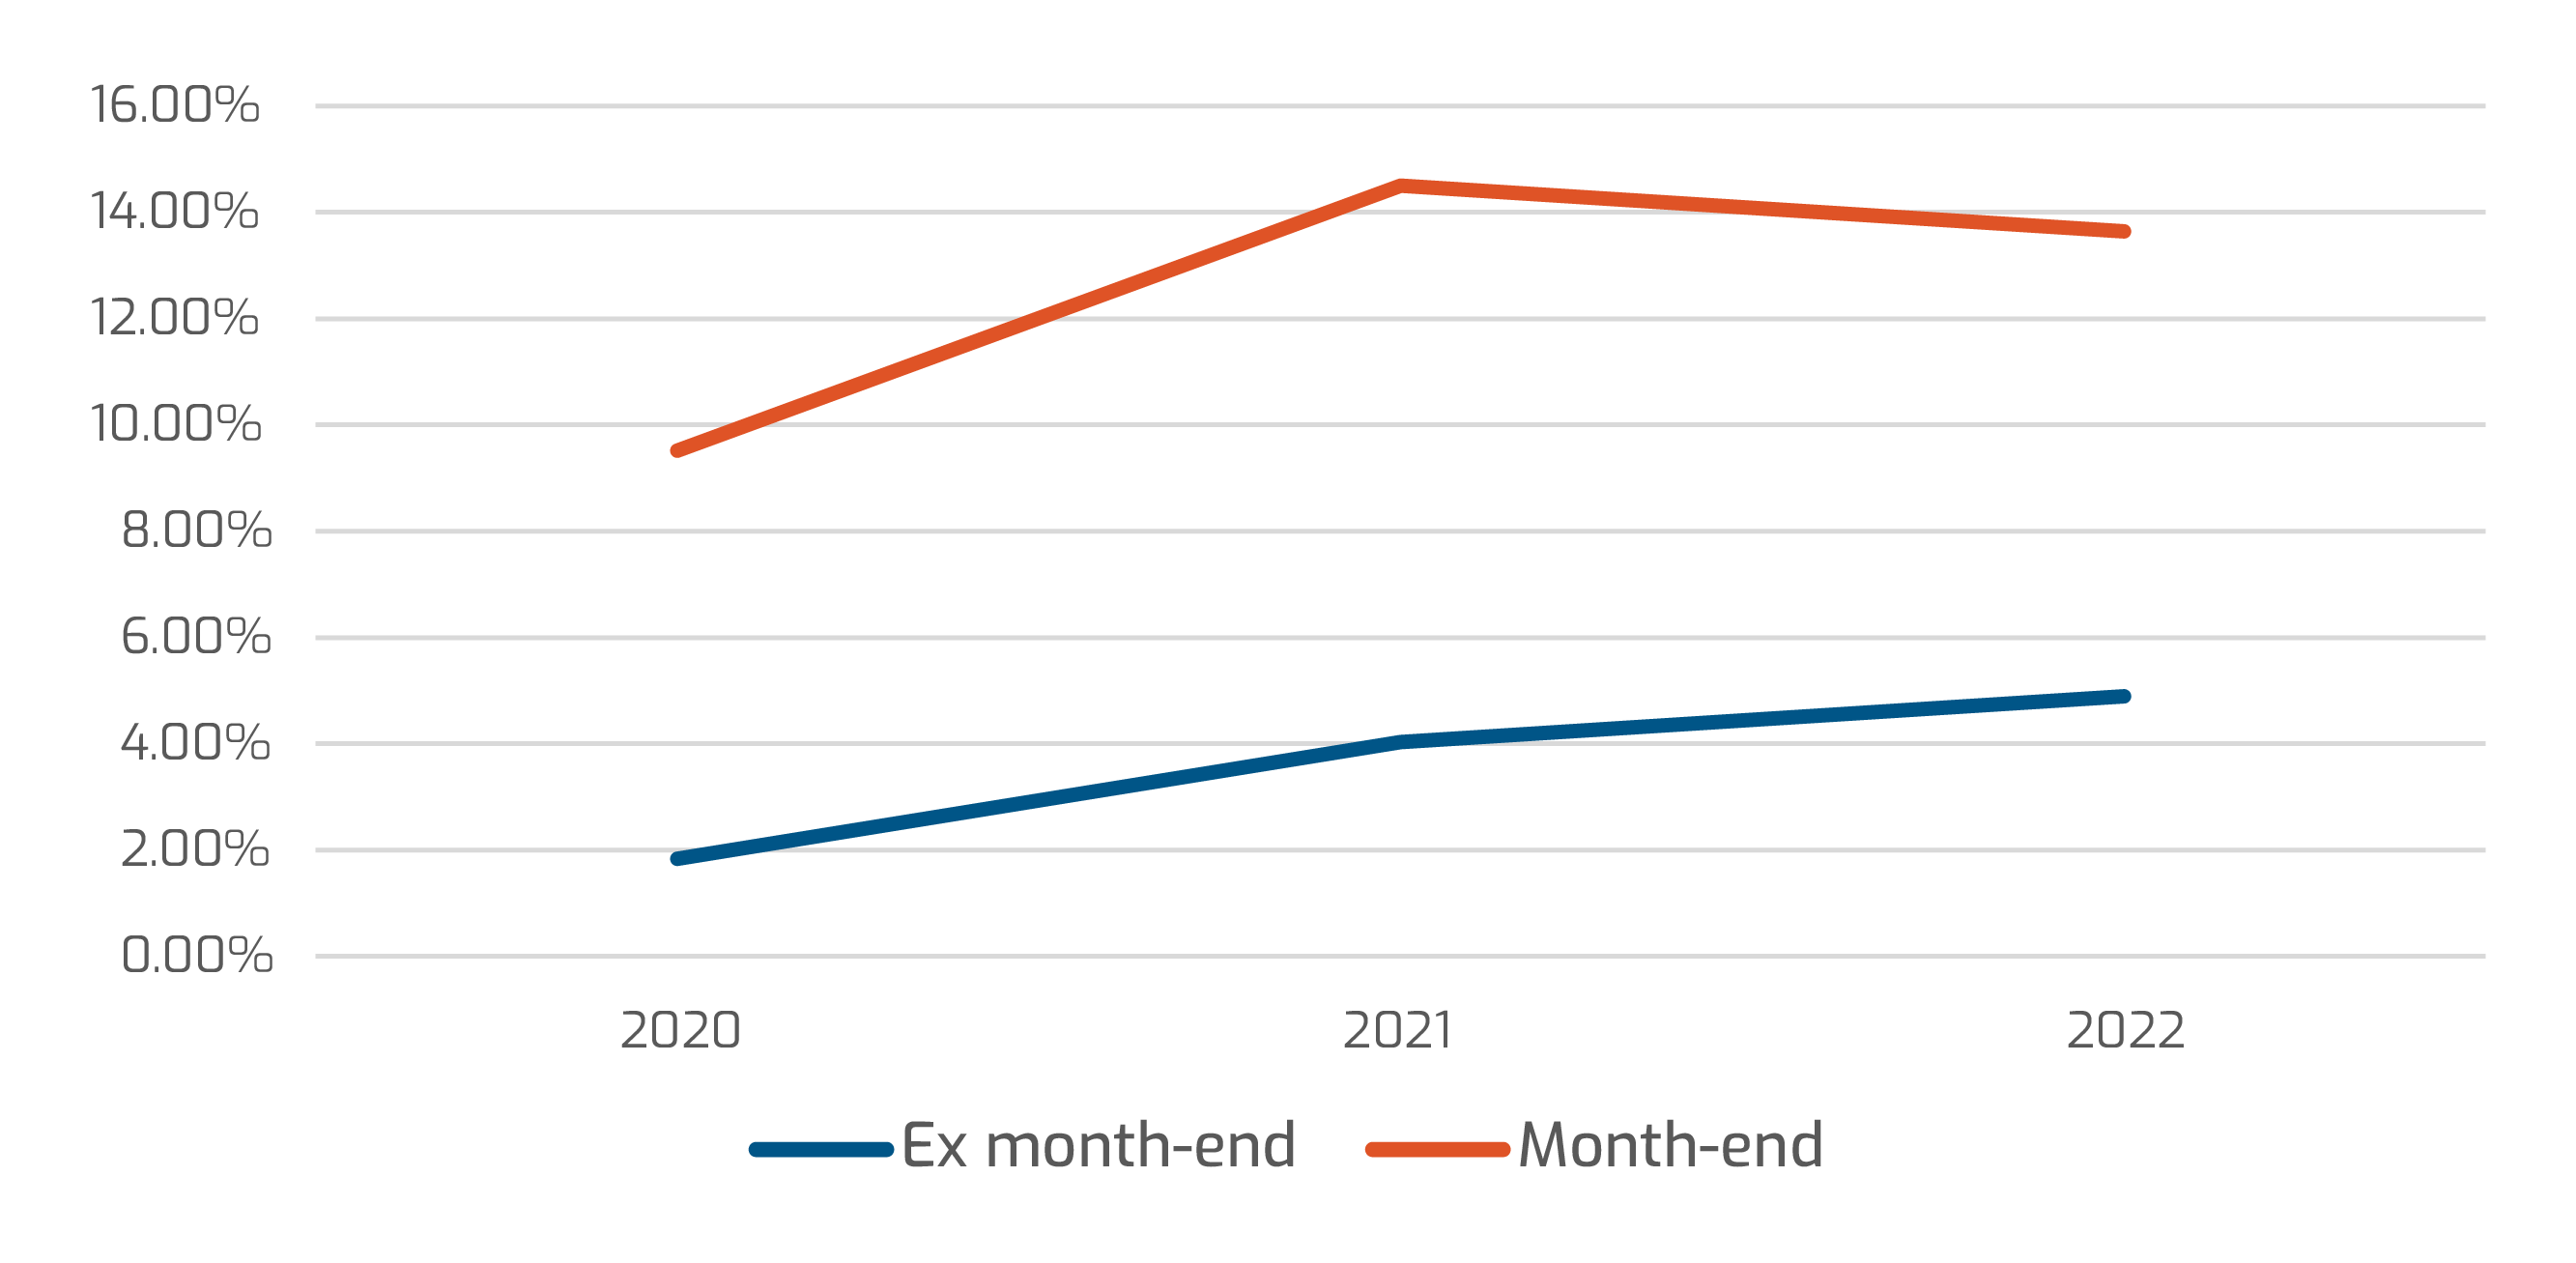
In tandem with the increase in volumes overall, we also see a spike in trading in efficiency-oriented electronic engagements during month-end days. The most common examples can be seen in automated RFQ (Auto-X) and Portfolio Trading. For High Grade, the traded count share of Auto-X at month-end is on average 1.26x the ex month-end day count share since data was collected in Q1 2020. The same trend can be seen in High Yield with more fluctuation, volume at month-end is on average 2.14x the ex month-end volume.
Median count share for Auto-X on MarketAxess for High Grade
Median count share for Auto-X on MarketAxess for High Yield
We see a similar pattern in Portfolio Trading. Month-end volume share on TRACE was on average 2.34x ex month-end volume share for High Grade and 3.86x for High Yield. The trend of smaller tickets size and larger number of tickets are potentially encouraging traders to speed up execution on month-end with automation tools such as Auto-X, which requires less manual intervention and protocol such as Portfolio Trading that can move a large number of positions and provide certainty of execution for less liquid bonds.
Median volume share for PT on TRACE for High Grade
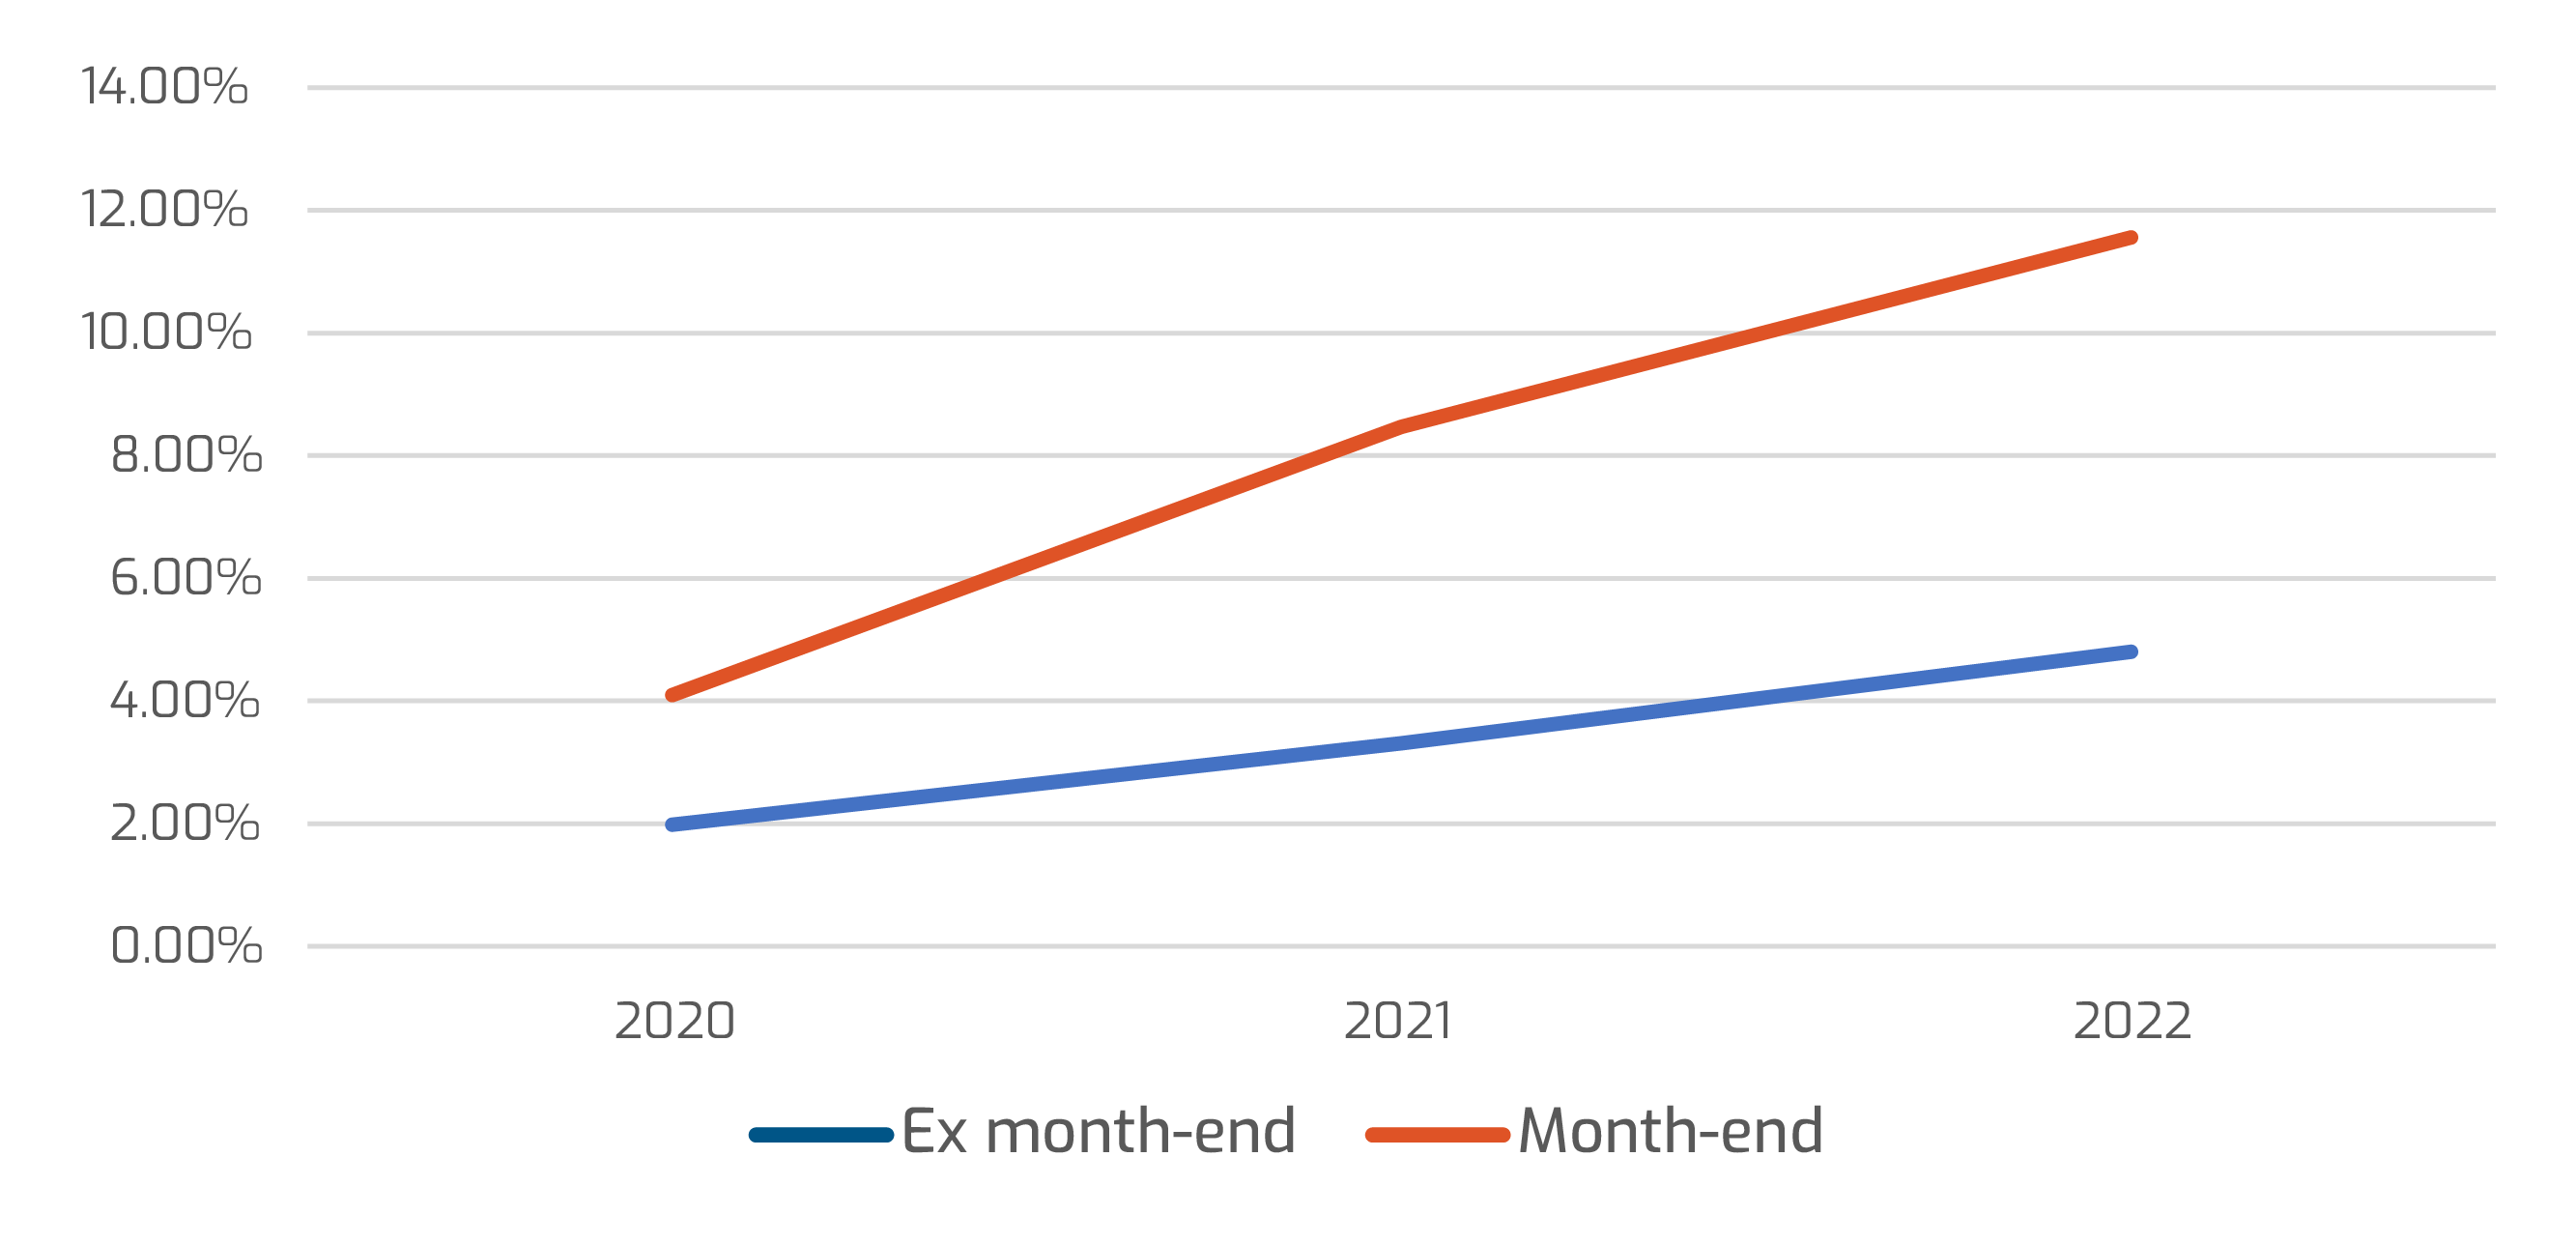
Median volume share for PT on TRACE for High Yield
Results
TRACE data showed a clear pattern of increasing trading volume on the last trading day of the month, with volume concentrating near the end of the trading day. Increased volume could present opportunities and risk. Firms that are cognizant of this on either side would be reminded to consider how they can best assess activity pre-trade when executing into the market at that point, and to consider which trading protocols might best manage the risks that they face to mitigate them effectively.
*For this analysis, we removed May, July, August, November, and December because of lesser volume due to either the summer lull or proximity to US holidays. The analysis used TRACE data from 2008 Q1 to 2023 Q1.