
AxessPoint: Intraday liquidity trends
This AxessPoint takes a look at intraday liquidity trends and the factors that impact this activity. A deep dive reveals that access to liquidity is strong throughout the trading day as indicated by cost of trading and depth of liquidity. We start by looking at market liquidity through the traded volumes in US IG and EU IG that are reported to TRACE and TraX®, respectively.
Highlights
Intraday trends in volume are driven by liquidity taker workflow, not liquidity provider activity.
Access to liquidity is strong throughout the trading day as indicated by cost of trading and depth of liquidity.
Liquidity Taker Activity
We first look at market liquidity through the traded volumes in US IG and EU IG that are reported to TRACE and TraX®, respectively.
In US IG, 10% of trading volume is reported at the precise moment of benchmark price determination—a process known as "spotting," where trades are logged at the exact time the benchmark's price is established. 11am, 3pm and 4pm are the most common spot times. 12% of client submitted RFQs on MarketAxess by trade volume use a delayed spot. For this analysis, we remove TRACE prints that occurred at common spot times as the spread for these trades could have been agreed upon at any point prior in the day.
Both US IG and EU IG volumes exhibit dips and peaks throughout the day. At first glance, this might suggest a changing liquidity landscape. However, understanding the full market dynamic requires a deeper dive into the driving forces behind executed volumes.
Distribution of Traded Volume
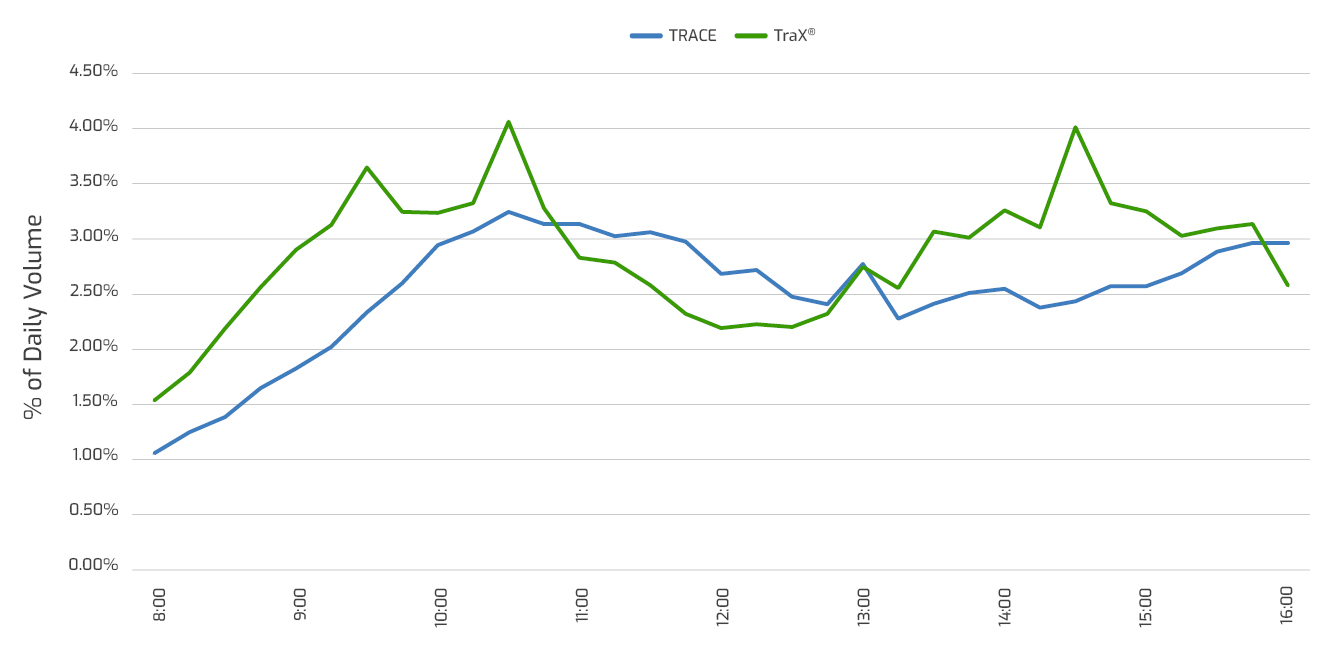
Figure 1 | Bins represent 15-min sum. Time is local (London for TraX, New York for TRACE)
We further analyze the client-initiated inquiries on the MarketAxess platform. Our findings reveal that requested volume trends closely mirror those of executed volumes, indicating that executed volume patterns are influenced by the actions of liquidity takers.
Distribution of Inquiry Volume on MarketAxess
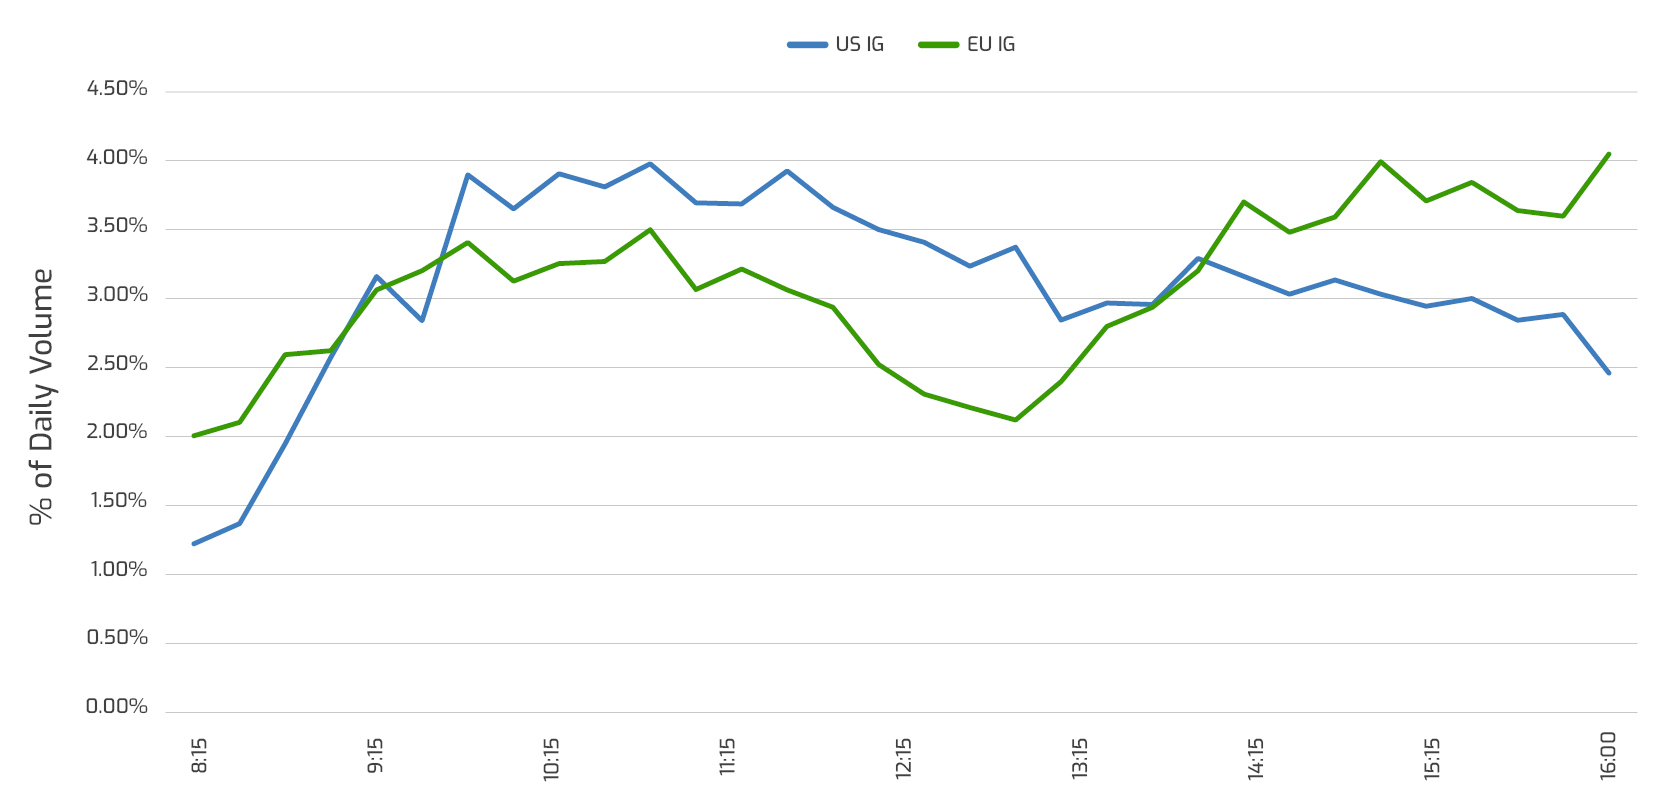
Figure 2 | Time is local (London for EU IG, New York for US IG)
Through inquiry volumes and executed volumes, we observe trading patterns of liquidity takers. We now examine cost of trading and depth of liquidity intraday, which gives alternative measures of liquidity.
Cost of Trading
By using CP+™, which is the MarketAxess AI powered algorithmic bond pricing engine, and more particularly CP+ Bid-Ask Spread, we can evaluate pre-trade cost of trading. The B/A spread gives the expected round trip cost. In both US IG and EU IG, trading costs decline in the first hour of the day before remaining close to constant for the rest of the session.
CP+ Bid-Ask Spread
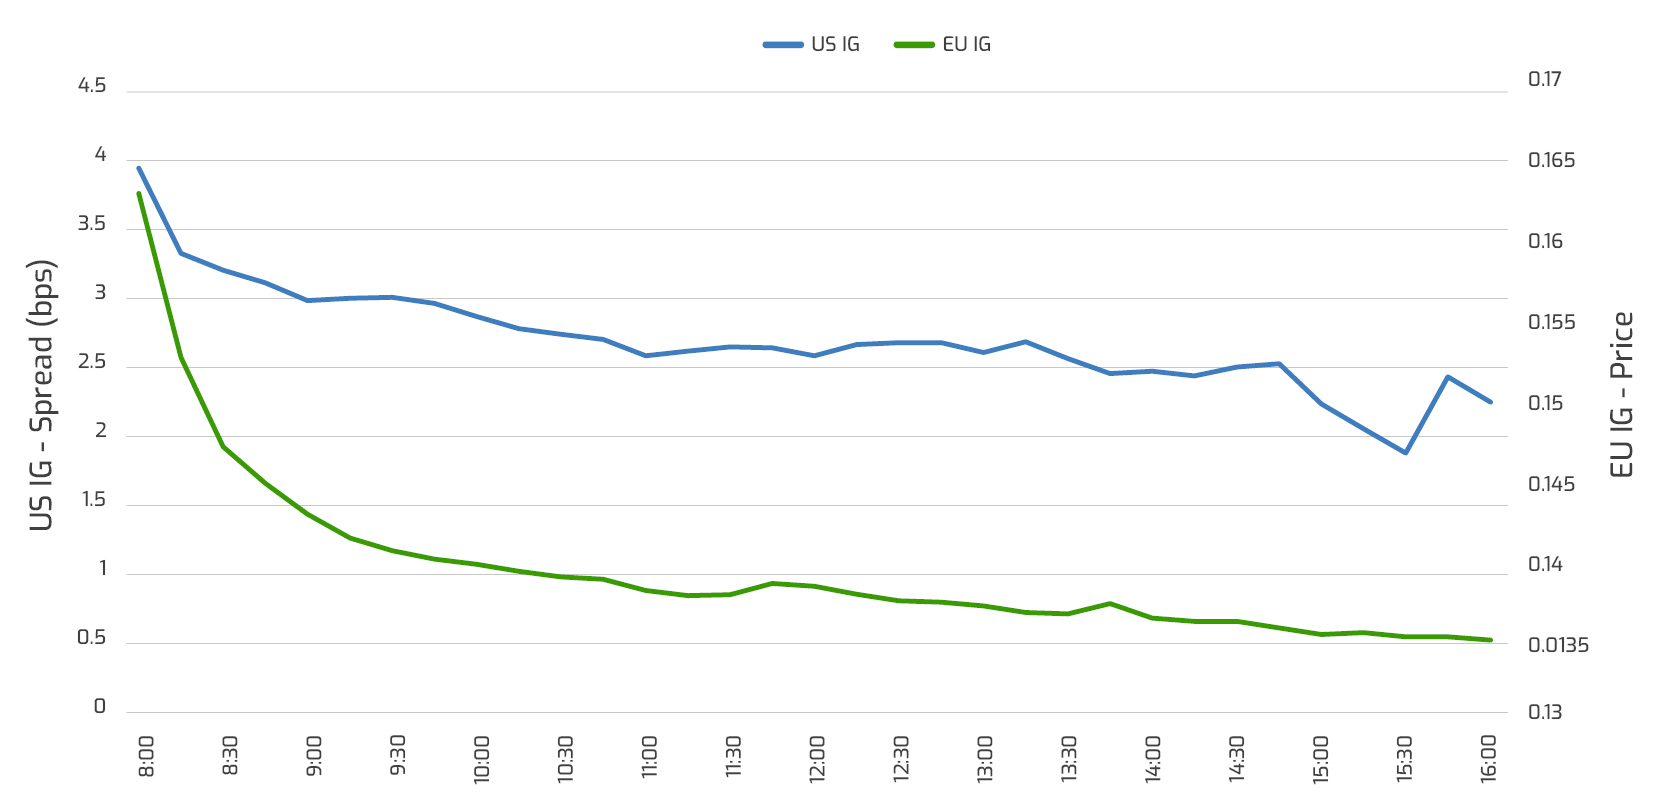
Figure 3 | Difference between CP+ bid and ask predictions. Time is local.
We can also look at the realized cost of trading on the MarketAxess Platform. For this, we use Transaction Cost Analysis (TCA) which is the delta between executed level and CP+ of the corresponding side. Investors obtained constant TCA throughout the day. TCA in H1 2024 was 1 cent in US IG and 0 in EU IG on client initiated.
TCA on MarketAxess
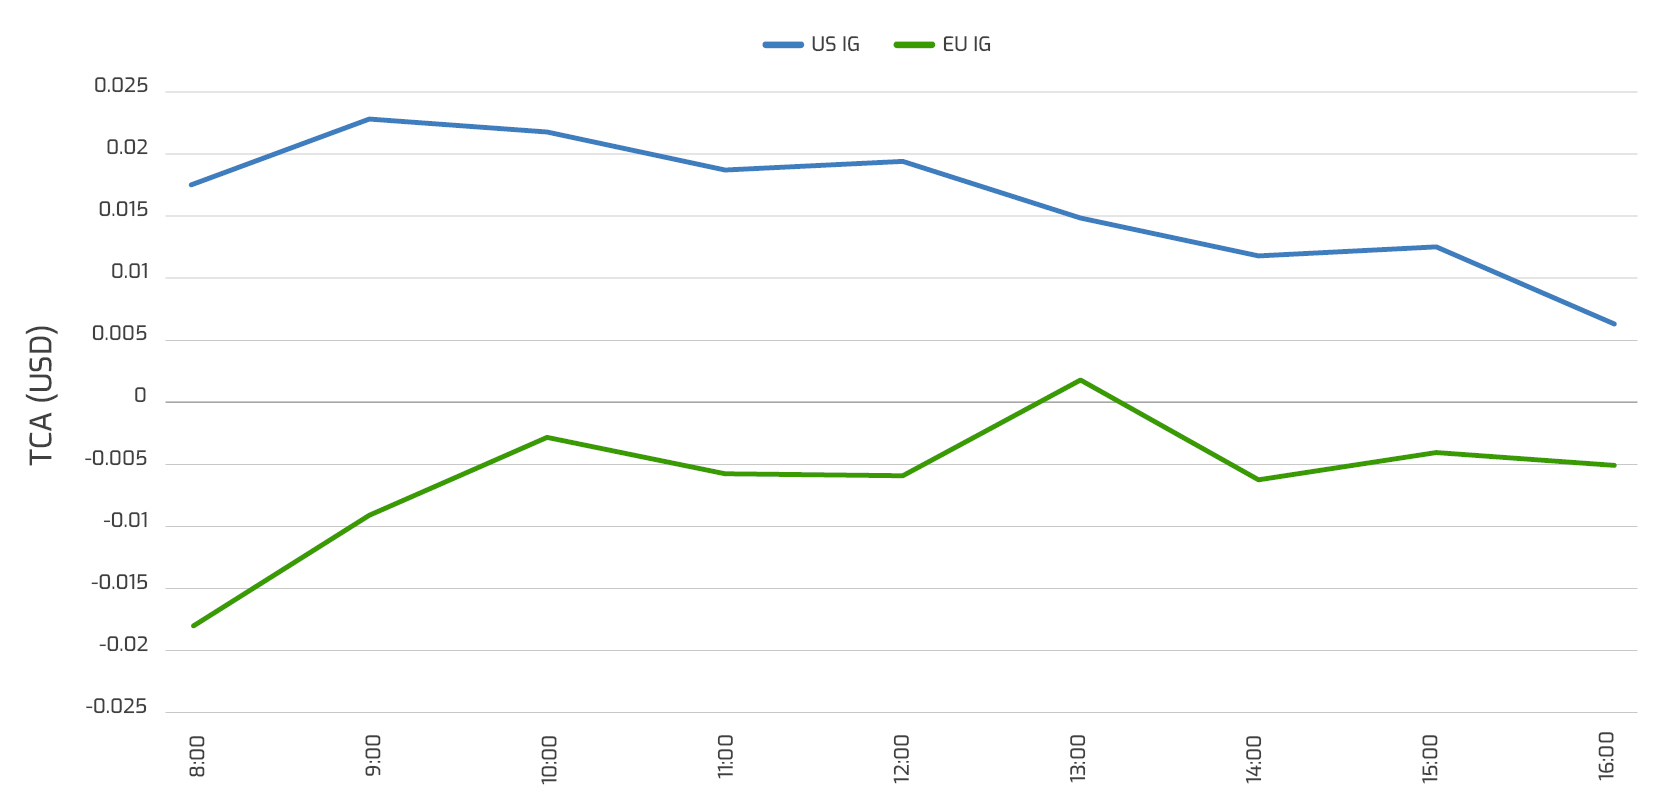
Figure 4 | Cost of transaction compared to CP+. Time is local.
Depth of Liquidity
Strong access to liquidity is further seen through Tradability, MarketAxess’ AI-powered gauge of liquidity that predicts the expected number of disclosed and anonymous responses a given inquiry will receive on the MarketAxess platform.
A higher Tradability signals a deeper market. In both US IG and EU IG, Tradability climbs for the first hour of the day, before remaining constant for the rest of the session. This consistency further supports our finding that access to liquidity remains stable from 9:00am till market close.
Tradability Predictions
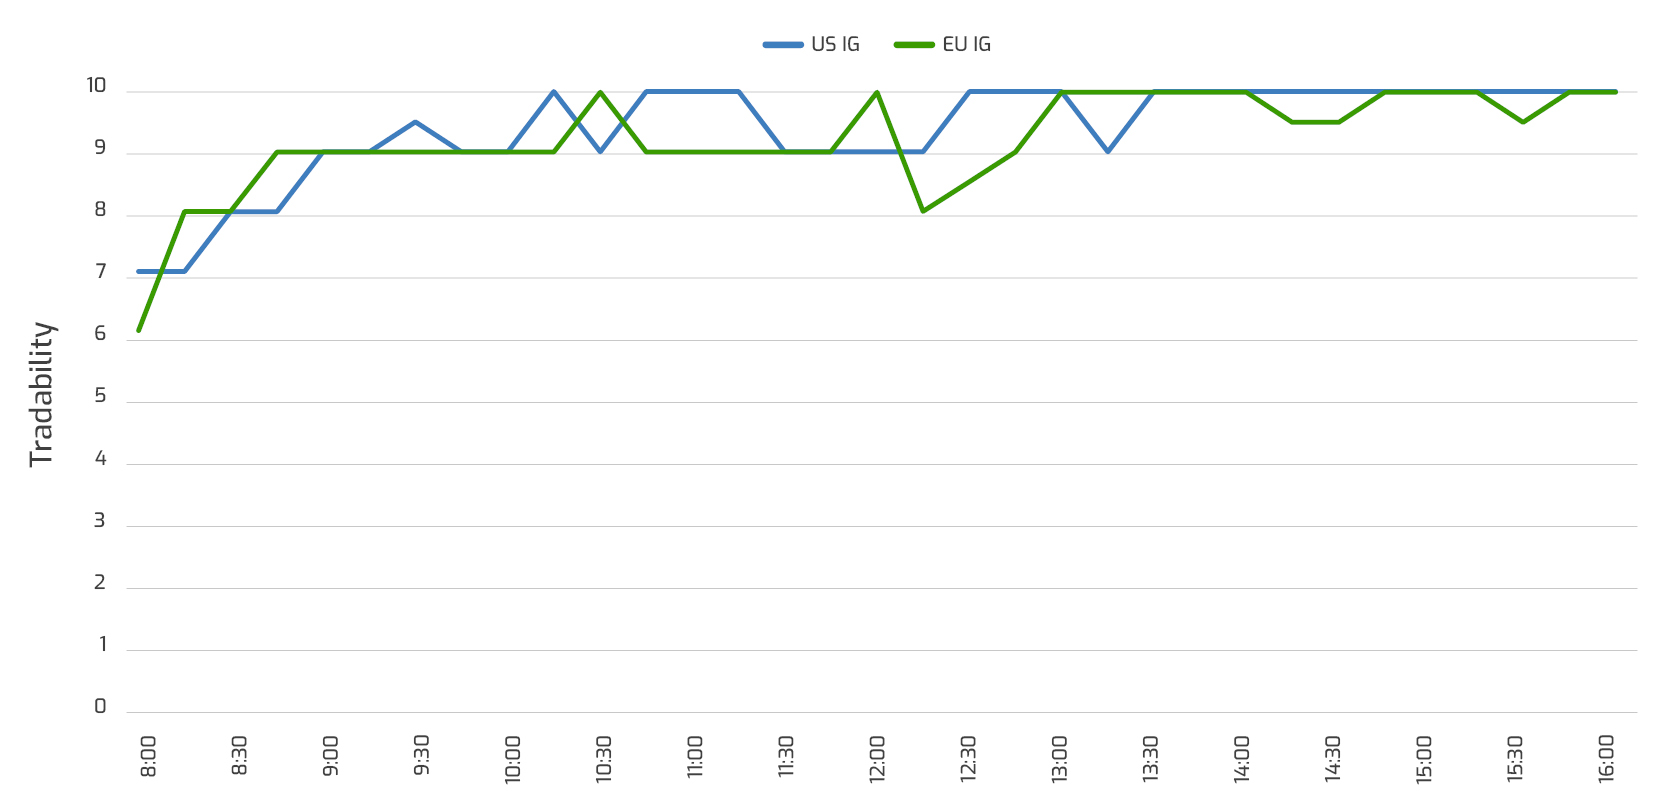
Figure 5 | Average Tradability. Time is local.
While Tradability measures the expected depth of the market, the realized number of responses to an RFQ gauges actual depth of market. In both US IG and EU IG, the average number of responses from a liquidity provider remains strong from 9:00am onward – with 12.31 responses per inquiry in US IG and 10.60 responses per inquiry in EU IG in H1 2024. The stability of responsiveness strengthens our conclusion of sustained access to liquidity from 9:00am till market close.
Responses Per Inquiry on MarketAxess
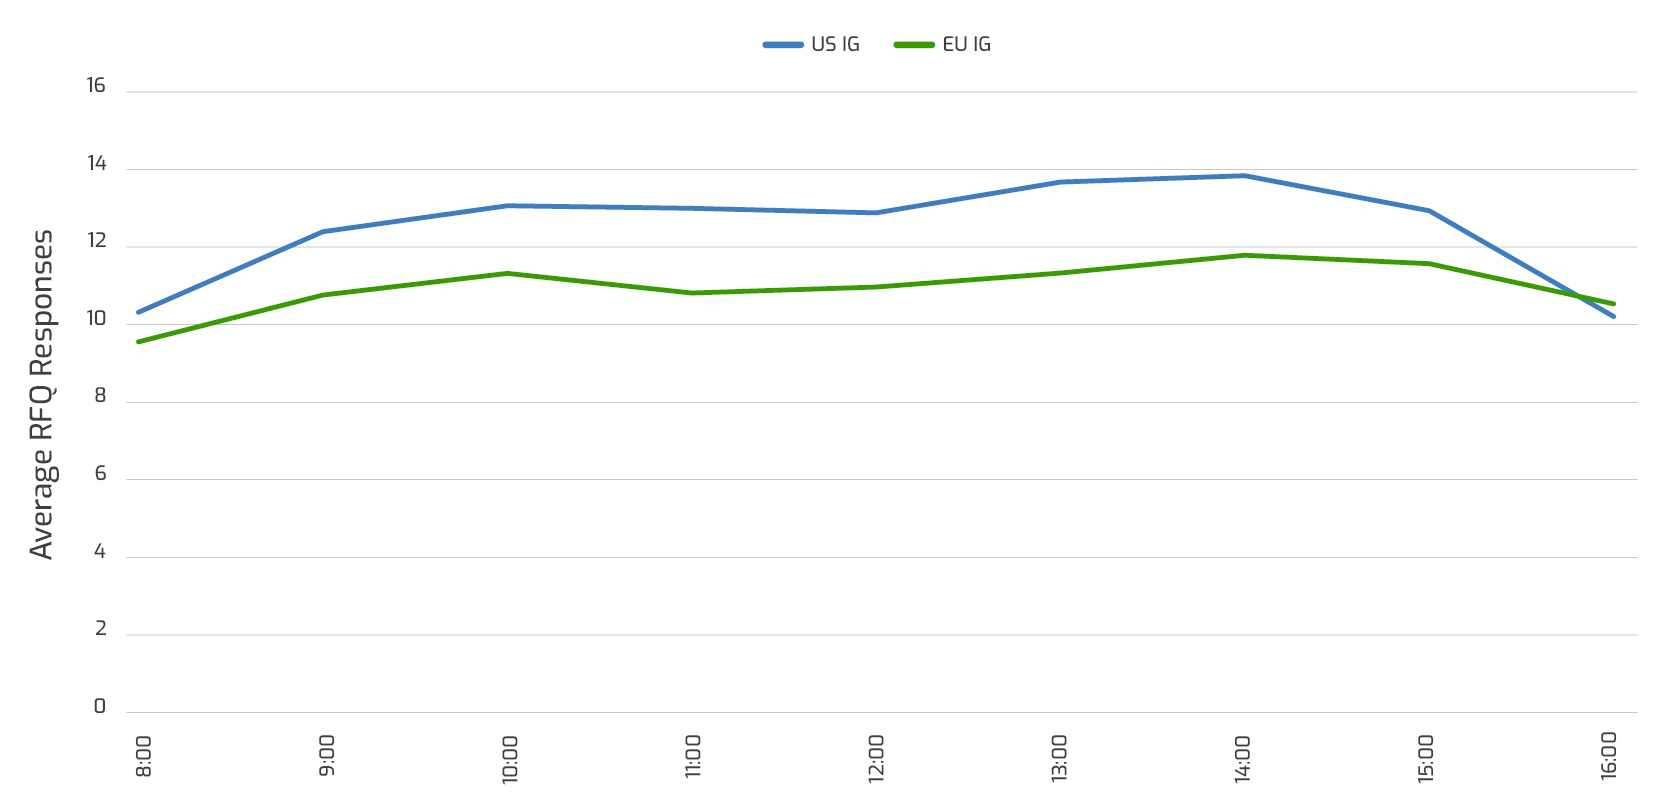
Figure 6 | Average responses throughout trading day. Time is local.
Conclusion
Both predicted and realized trading costs and depth of liquidity provision exhibit that liquidity is strong and constant intraday. Liquidity providers supply consistent liquidity all day. Patterns in overall volumes can be explained by liquidity taker workflow. Traders should feel comfortable accessing liquidity all day long.
CP+ is MarketAxess’ proprietary AI powered pricing engine for corporate bonds. It produces an unbiased, two-sided market for more than 33,000 instruments globally. Updated every 15 to 60 seconds, the engine generates nearly 30 million levels per day covering 90-95% of trading activity in its markets.
Tradability is MarketAxess’ proprietary AI powered liquidity metric for corporate bonds. It assesses the market’s capacity to provide immediate pricing to a specific order. It predicts the number of responses to a given RFQ inquiry pre-trade and is size and side specific. It covers nearly 18,000 bonds.
TraX data from MarketAxess aggregates bond market activity executed by European banks, asset managers and trading firms across both voice and electronic trading methods that is validated in near real-time through a post-trade regulatory reporting and trade confirmation engine.