
AxessPoint: Portfolio Trading and price discovery in US IG and HY markets
Executive Summary:
Portfolio trading (PT) enhances liquidity in difficult-to-trade bonds with its basket-based "all-or-nothing" method. It has gained popularity among traders, increasing volumes and market share for IG and HY trading recently.
PT is particularly beneficial for less liquid US Investment Grade and High Yield bonds. Some bonds trade primarily within PTs, helping to make more of the market tradable and, as such, aiding price discovery.
Although PT pricing is done at the basket level, reducing focus on line-item accuracy, the gap between PT and RFQ pricing precision is narrowing.
In our recently published Portfolio Trading vs RFQ List White Paper, we discussed how Portfolio Trading offers benefits for traders looking to trade illiquid bonds. One of the advantages of the PT protocol is that when included in a well-balanced basket, line items with lower liquidity scores typically receive more favorable outcomes compared to execution with RFQ lists.
To expand on this concept, we dive deeper into PT as a mechanism for price discovery for US IG and HY bonds. As illustrated in the white paper, the generally held tenet is that portfolio trading is preferred for illiquid bonds. This is at least partially attributed to traders taking advantage of the protocol to attend to bonds that they may have little to no chance to trade otherwise. We can confirm this by observing several low-liquidity bonds traded primarily through PT.
Additionally, we also evaluated the pricing precision of PT and RFQ execution against CP+™, MarketAxess’ proprietary real-time AI pricing engine. From this, we can measure the precision of price discovery from PT as the market adopts this new protocol.
Rise in PT volume
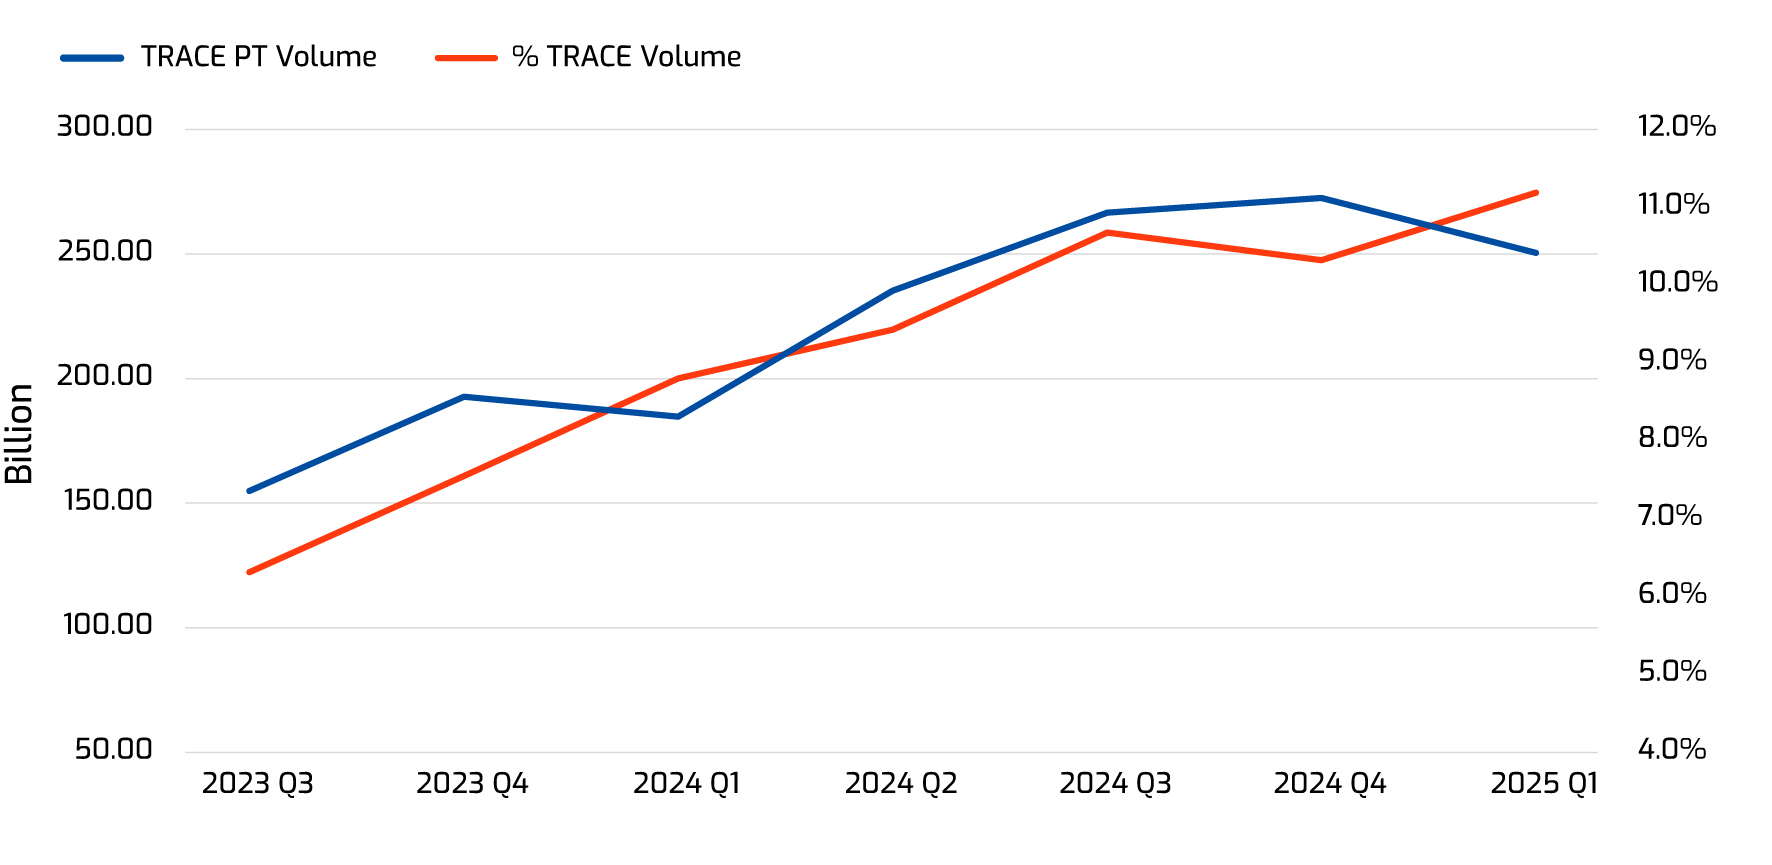
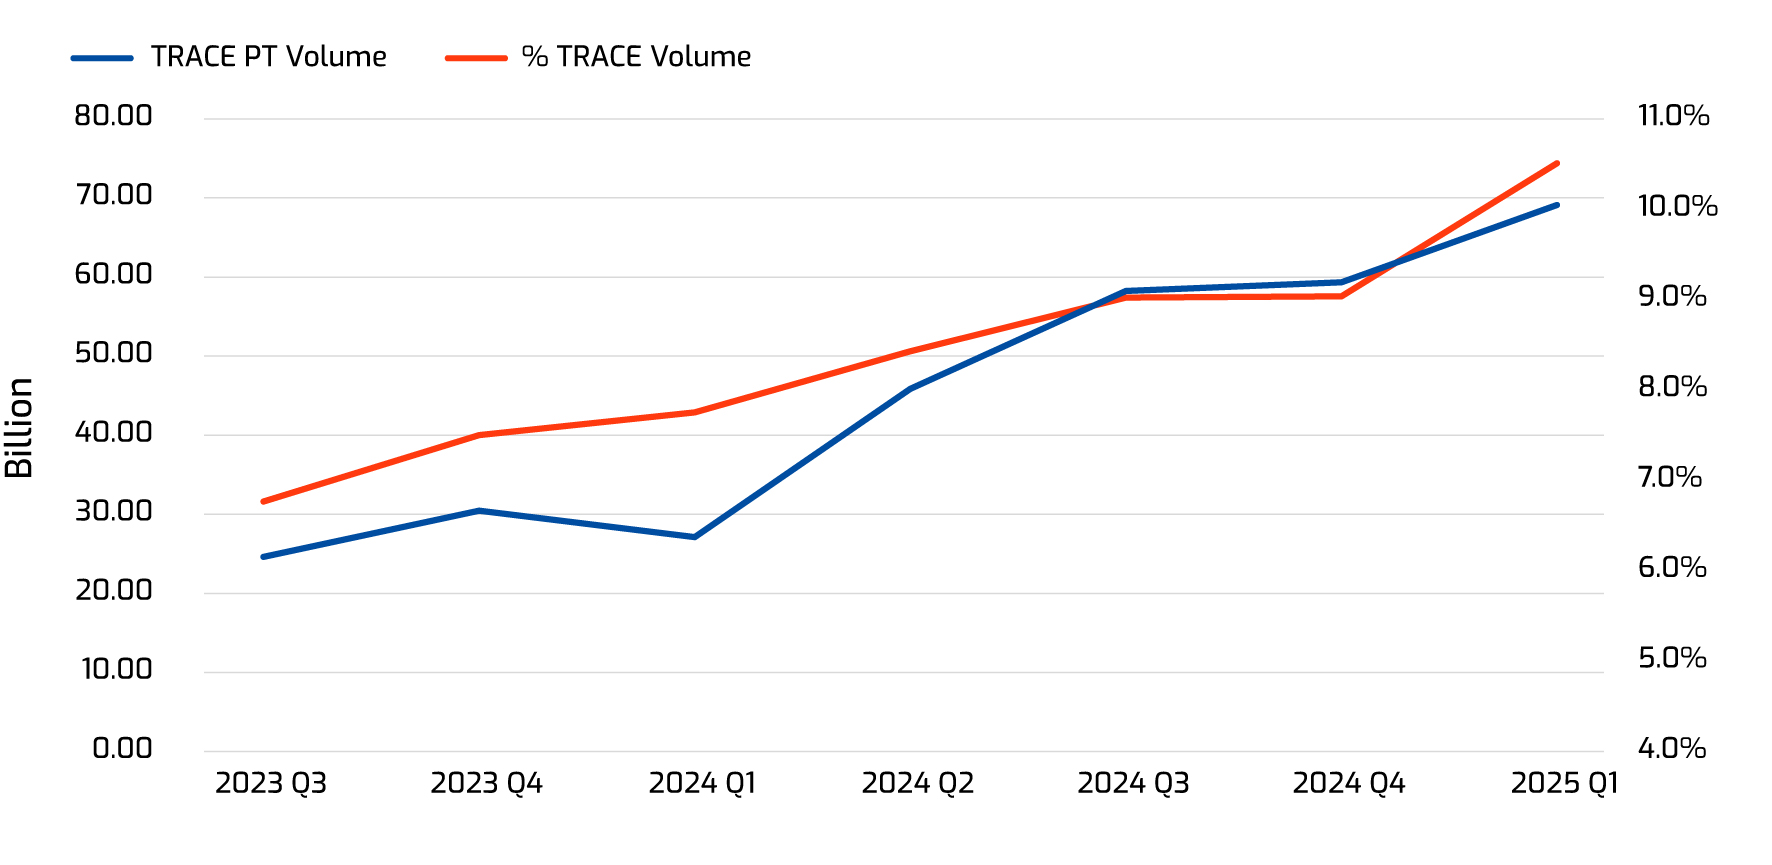
For the last three years, PT has seen explosive growth in absolute volume and share of TRACE volumes. IG volumes rose from $122 billion in Q3 2023 to $275 billion by Q1 2025 , jumping from 7.4% to 10.4% of TRACE volumes. HY PT saw similar growth, rising from $32 billion to $74 billion, jumping from 6.2% to 10% of TRACE volumes.
Volume in Portfolio Trading in US IG
Volume in Portfolio Trading in US HY
Portfolio Trading accounts for a higher percentage of all trade activity for Illiquid bonds
As mentioned in our PT vs RFQ white paper, liquidity plays a major role in the composition of a PT basket. In the most efficient portfolio trades from a cost perspective, traders use PT to blend a mix of illiquid bonds in the same basket as liquid bonds. We measure liquidity for this case using the MarketAxess Relative Liquidity Score (RLS), which measures bonds on a scale from 1 (least liquid) to 10 (most liquid). More information on the score methodology can be found here.
Share of TRACE trades via PT by Liquidity Score - HG
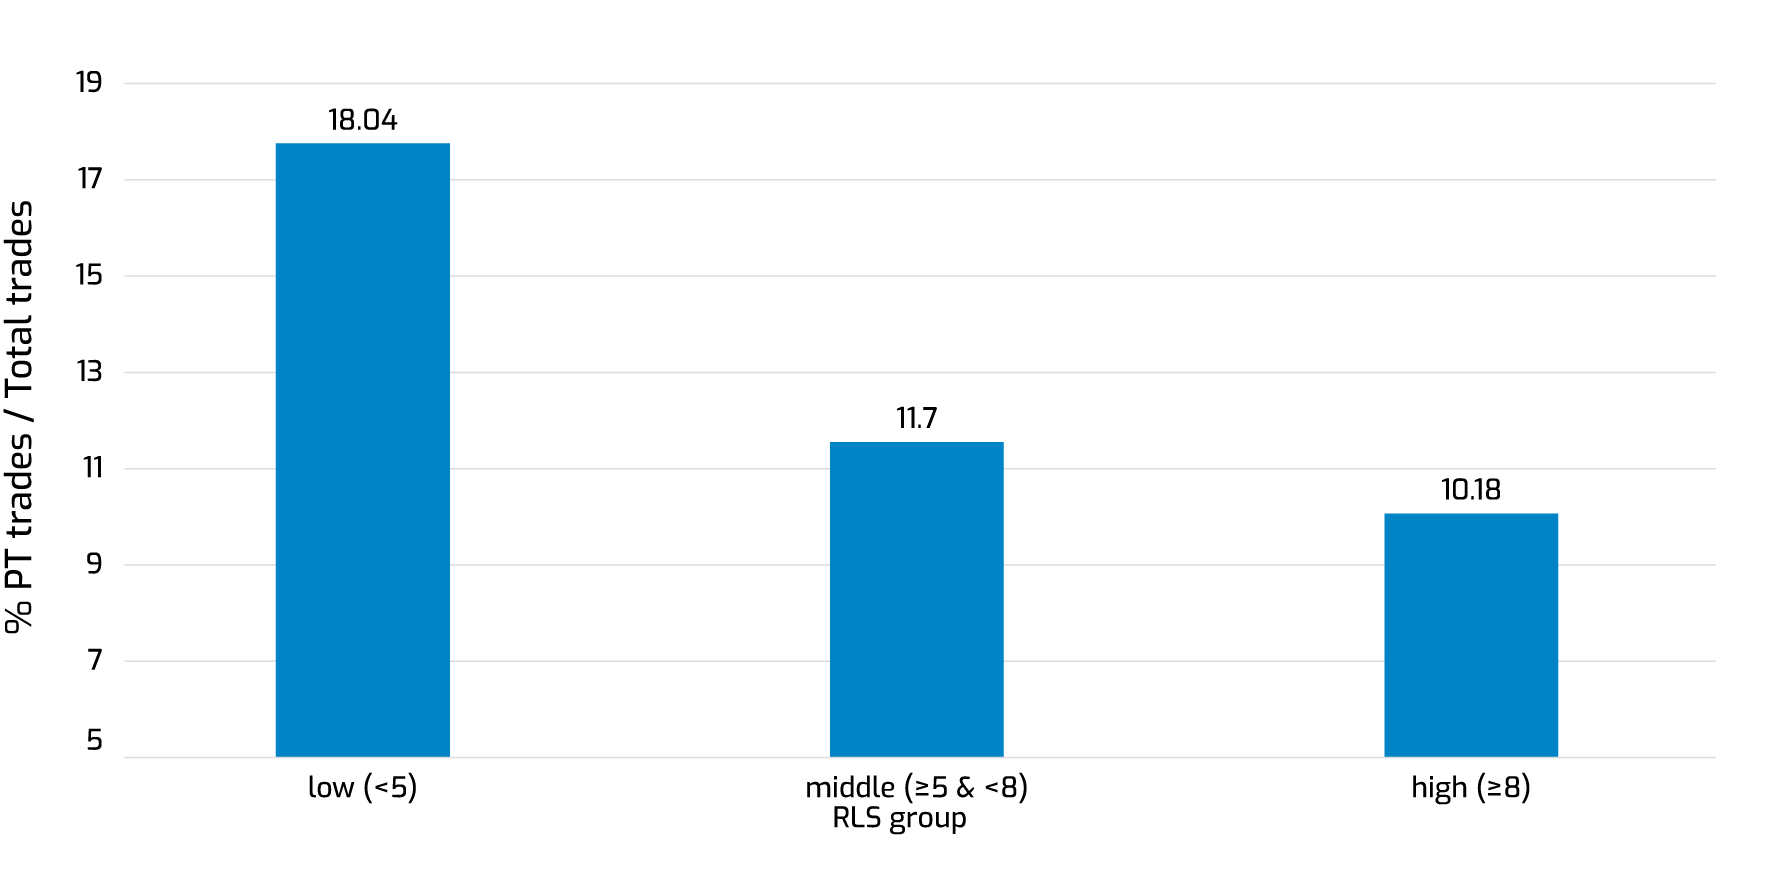
From the above chart, we see that between Oct 2024 and March 2025 in IG, for bonds with at least one trade, on a per bond basis an average of 18.04% of trading activity is executed through PT for bonds with low liquidity score (<5), whereas for bonds with high liquidity score (≥8), only 10.18% of trading activity are executed through PT. This shows a clear divide between the importance of PT between the liquid and illiquid end of the market.
Share of TRACE trades via PT by Liquidity Score - HY
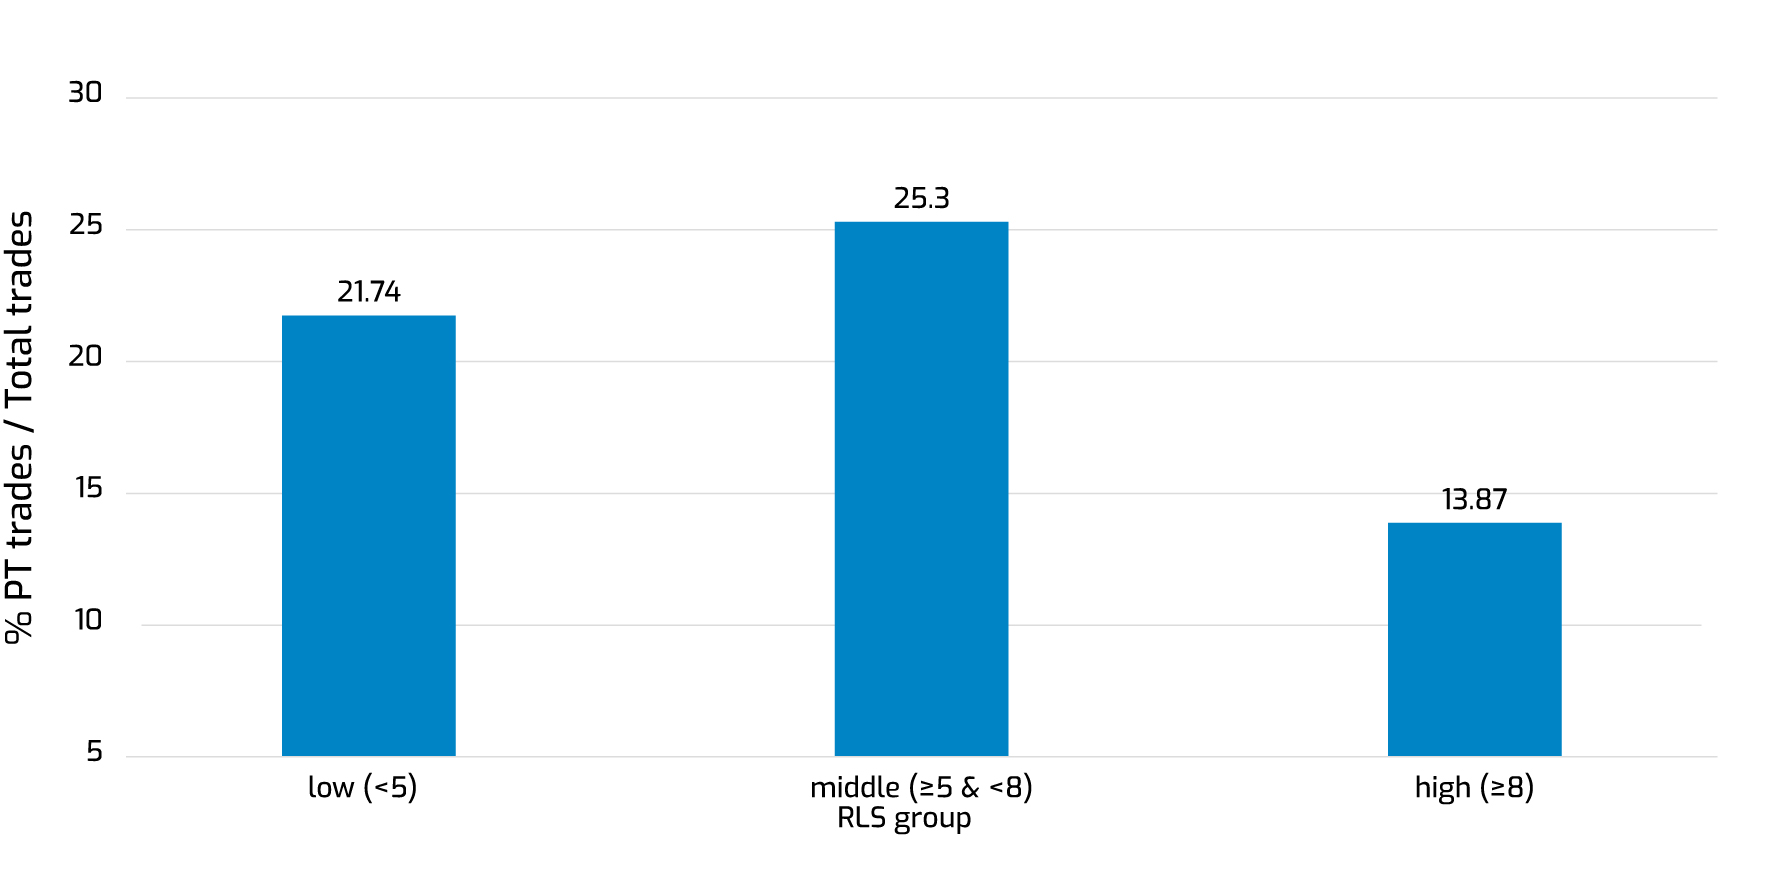
We can do a similar analysis for HY. From the chart below, we see that for the same period, on a per bond basis an average of 21.74% and 25.30% of trading activity is executed through PT for bonds with low and middle liquidity score respectively, whereas for bonds with high liquidity score, only 13.87% of trading activity are executed through PT.
CP+ Median Absolute Deviation for Portfolio Trade and RFQ
CP+ is designed to predict trade prices for institutional size trades (≥150k). It uses a consistent methodology across various market conditions, making it a reliable benchmark for measuring pricing precision. In the charts below, we plot the median absolute deviation (MAD) of MarketAxess platform traded levels to CP+ to measure the pricing precision of PT and RFQ.
Median Absolute Deviation by PT flag in HG - On Platform
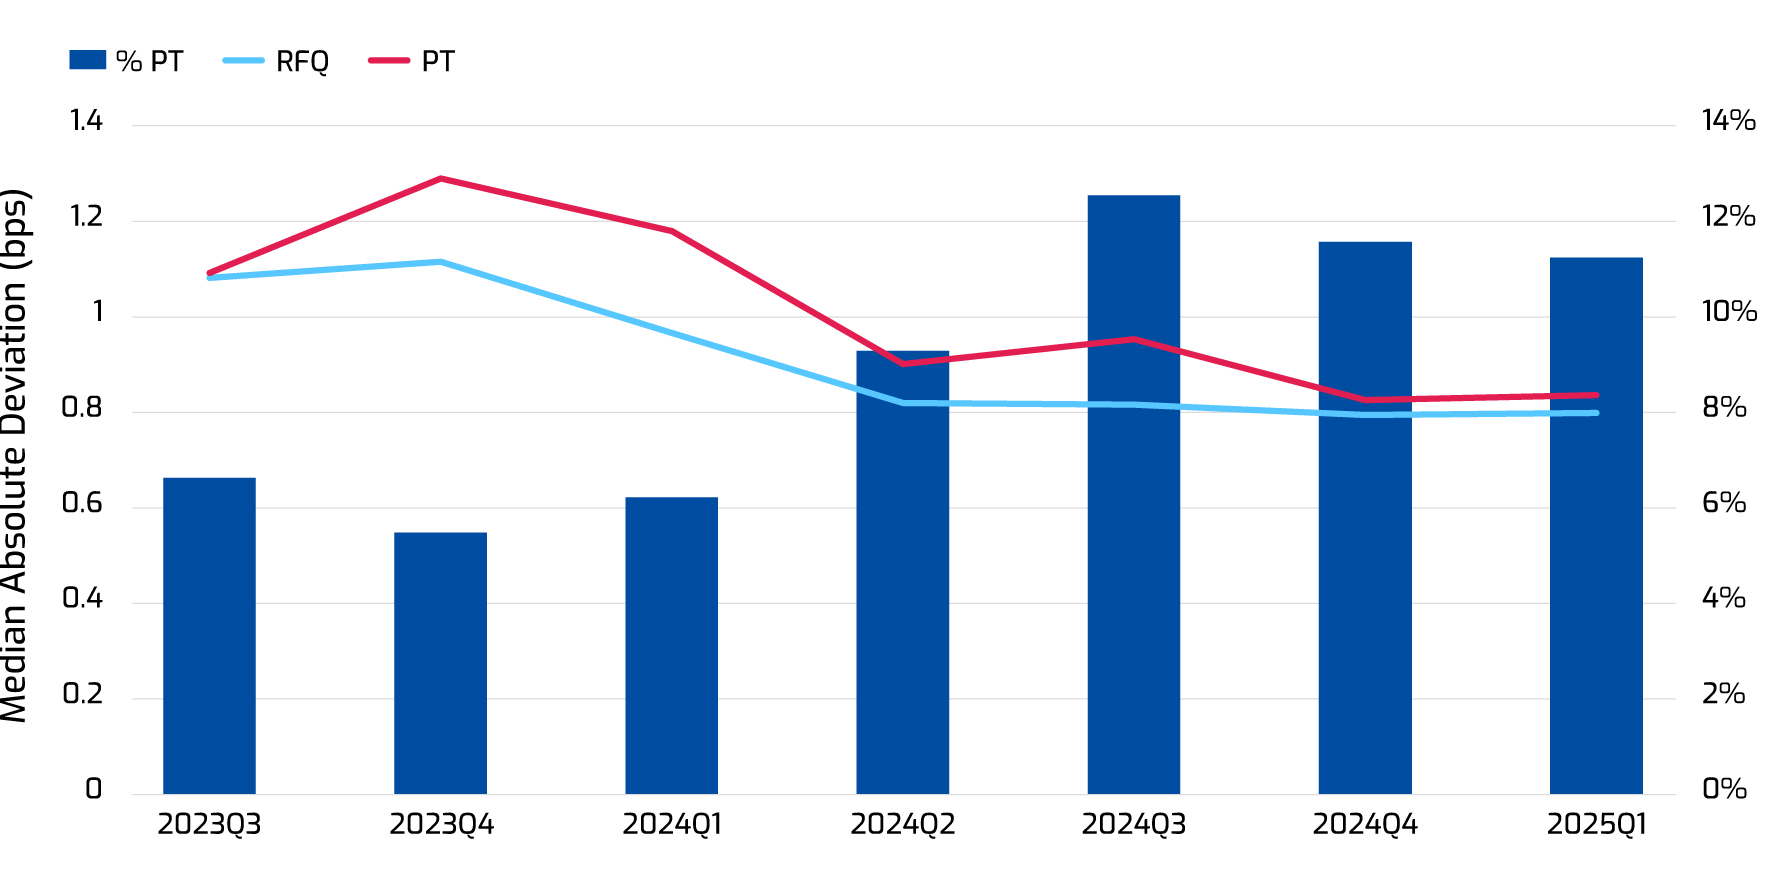
While PT MAD used to be consistently higher than RFQ MAD, reflecting lesser line-item level pricing precision for PTs compared to all other trades to RFQ, we see this difference diminishing significantly in recent quarters. This indicates that the price discovery effect of PT is close to that of RFQ, as PT pricing accuracy at the basket level is increasingly like RFQ.
Median Absolute Deviation by PT flag in HY - On Platform
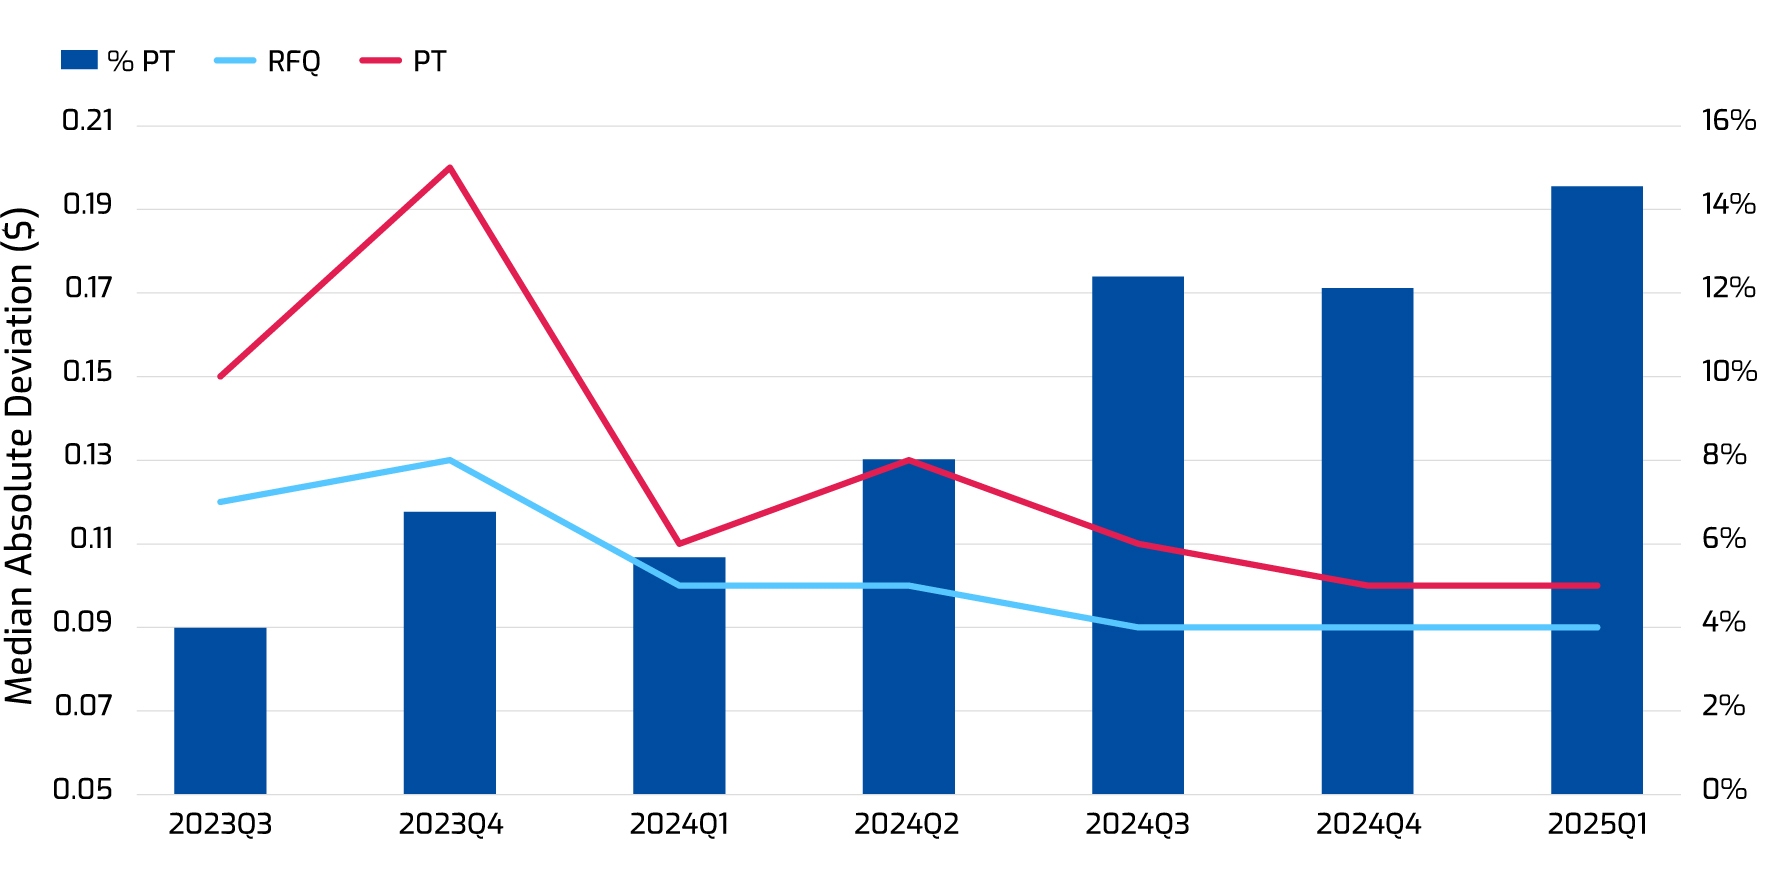
In HY, PT pricing quality was initially lower than RFQ in 2023, with median absolute deviation to CP+ at $0.17 for PT and $0.13 for RFQ. However, by Q1 2025, PT pricing deviation reduced to $0.10, close to the RFQ deviation of $0.09, indicating similar pricing precision as PT's share of trades increased.
Conclusion
Portfolio Trading has surged significantly in both volume and its share of TRACE activity over recent years. This evolution underscores the vital role Portfolio Trading plays in price discovery, particularly for illiquid bonds, which see a higher percentage of their activity within PT baskets. Remarkably, even though PT pricing is negotiated at the basket level, its pricing precision at the line-item level has increasingly mirrored traditional trading protocols like RFQ, enhancing overall market efficiency and price discovery.