
AxessPoint: Tradability deep dive—insights powered by an enhanced liquidity metric

Tradability is our machine learning based AI model that is calibrated to predict market depth on a bond, side, and size level. Tradability is primarily used for estimating responsiveness for a potential RFQ, but there are several supplemental insights that can be extrapolated with the knowledge of provider interest and market direction.
What to trade: Tradability assesses the current, absolute liquidity of an individual bond—helping traders determine whether a specific security can be executed efficiently right now, based on live market conditions.
How to trade: The difference between Tradability buy and sell values (skew) can be used as an indicator of pre-trade costs as well as future potential to unwind an order.
When to trade: Intra-day updates of the Tradability model give insight into current conditions and the market’s reaction to news on both a bond/ticker level as well as a market-wide basis.
Tradability is a tool that can be used as a standalone data input or as an expansion of our existing RLS (Relative Liquidity Score) product. RLS provides a defined measurement of the current liquidity for an individual bond, highlighting the potential ease that a trader can expect to transact in that instrument. Bonds with a higher RLS see more responses, smaller bid-ask spreads, and improved transaction costs (TCA). Tradability has a similar linear relationship for trades on bond/side/size situations with higher predictions.
We see a strong linear correlation between the number of responses an RFQ gets and expected execution quality. Additionally, Tradability goes further than RLS by not only being bond specific in its prediction but giving a score that is relevant for a particular order, due to the fact that it considers order side, size, and time of day. This directly leads to a further use case of the Tradability data set — it can be used to show not only which bonds to trade, but also how and when to trade. While traditional RLS can be used as a point of comparison between bonds to see which is more fit, Tradability can help us map out entry and exit liquidity due to its size and side characteristics.
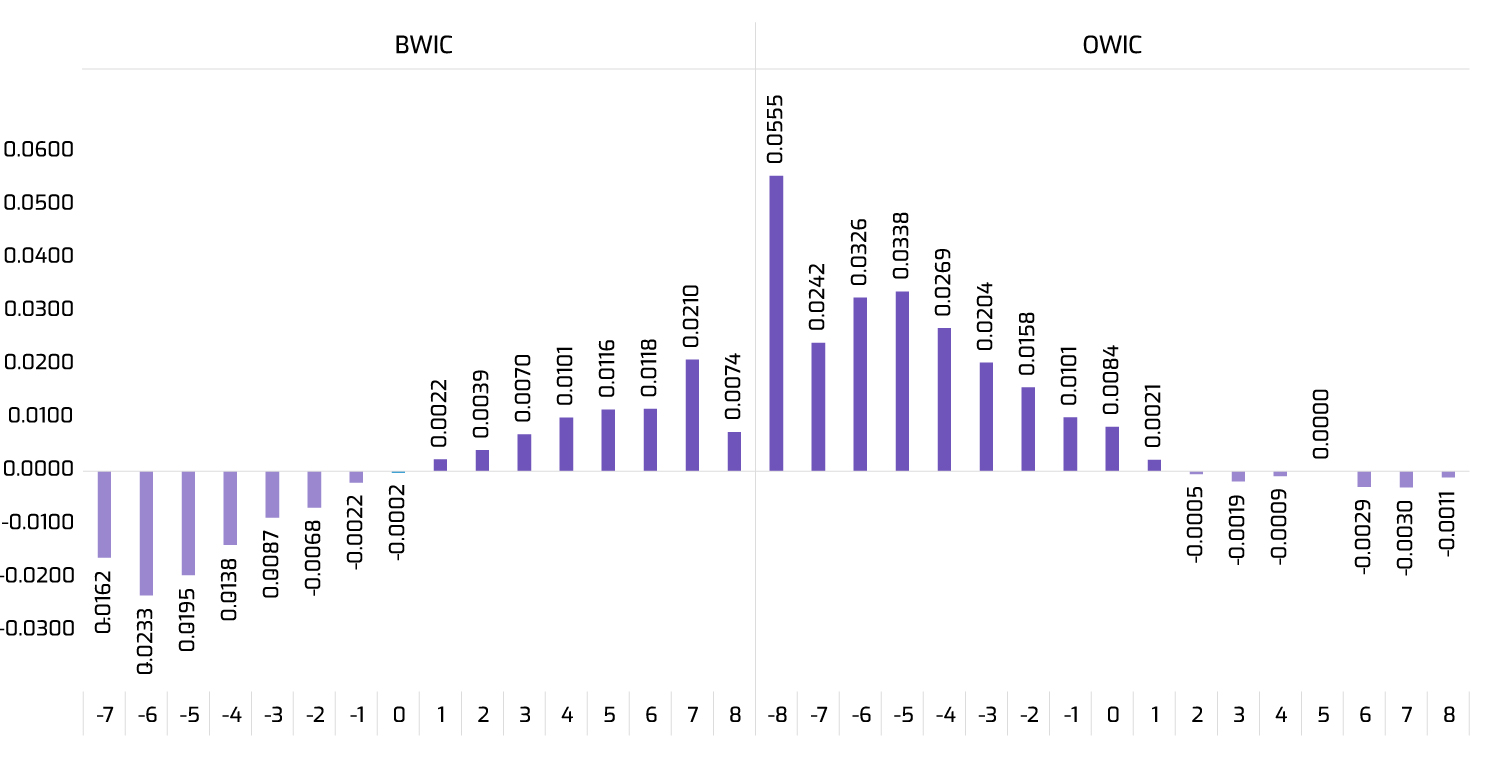
An important value that we can derive from Tradability data is skew, which measures the difference between the buy and sell predictions on a bond and size. The higher the skew value is, the cheaper it will be to purchase a bond, with differences measuring at 7-10 cents depending on prevailing market sentiment (figure 1). However, selling off that particular holding later may be costly if market direction holds. One potential outlet for orders like this may be through portfolio trading. As has been discussed in previous pieces like our PT vs RFQ white paper, illiquid line items in portfolio orders tend to see favorable execution outcomes when included in a well-balanced basket. This opens the opportunity to potentially acquire a bond with high skew cheaply via RFQ and exit the position later via PT.
Figure 1: RFQ TCA by Skew/Side
An example of Tradability aiding in how to trade can be seen in Auto-X™ RFQ. Historically, RLS has been used as a pre-trade selection criterion for automation eligibility. Tradability goes one step further by being not only instrument but also side and size specific. In this situation, Tradability can be used as a reliable guidepost for order selection. As can be seen in the chart below (figure 2), even for high liquidity bonds (defined as RLS of 7 and above) there are over 400 ISINs per day that have a Tradability skew of 3 or greater in either direction.
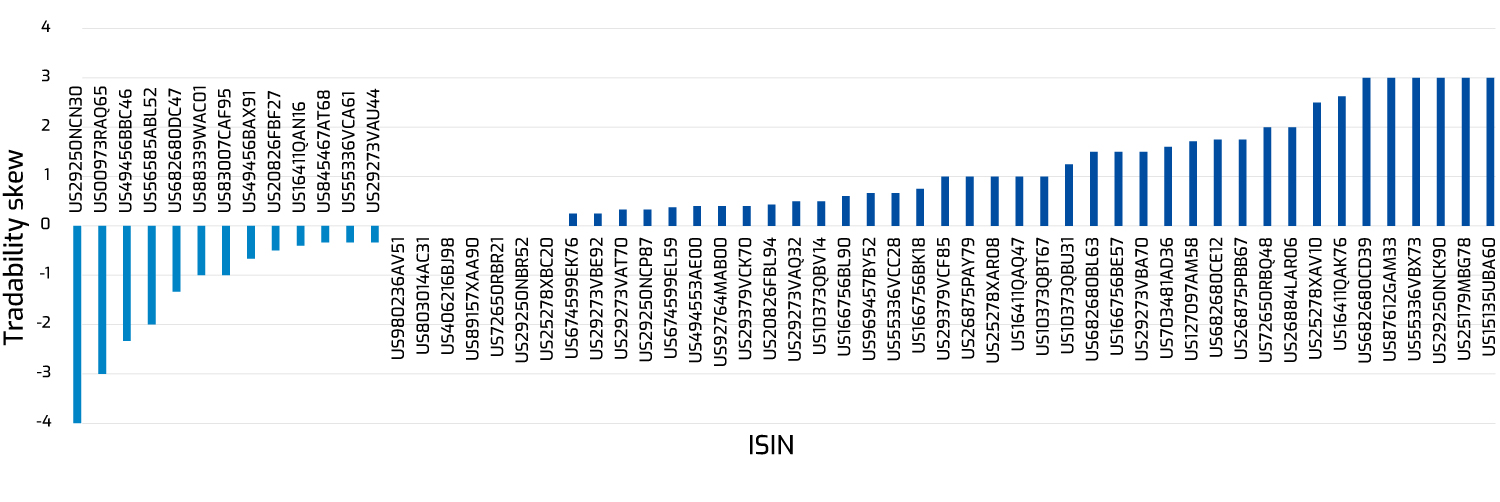
At times we observe cases at the bond or market level where the skew inverts, with sell interest outpacing buys. In a recent example here, we can see that due to issuer/bond level liquidity differences even bonds that would look identical from a liquidity score perspective see vastly different Tradability outcomes, either skewed towards buys, sells (inverted), or flat (figure 3).
Figure 2: Average daily number of ISINs by Skew
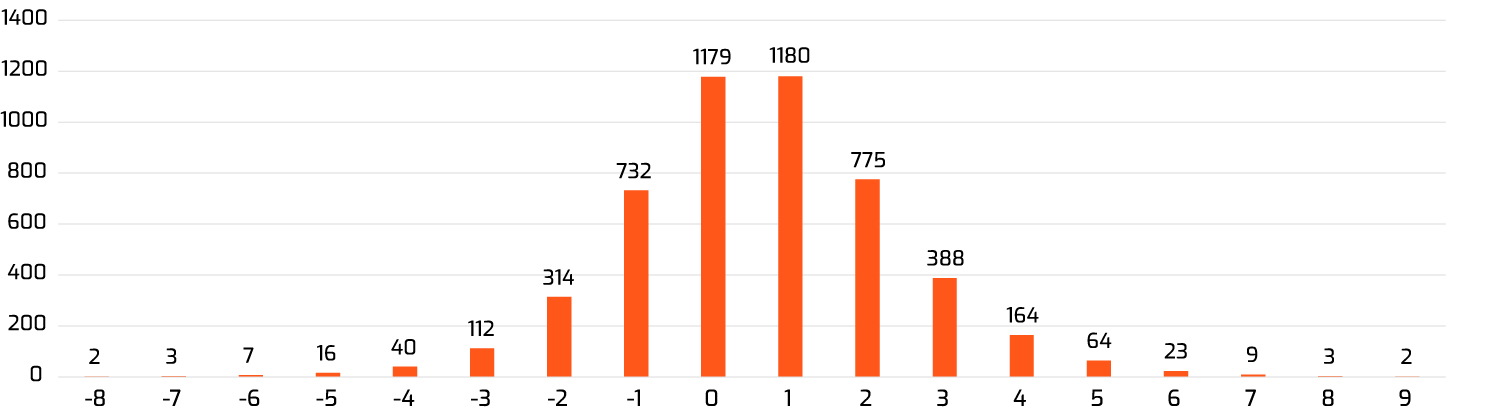
Figure 3: Tradability Skew for similar bonds (RLS 10, 5-year maturity bucket, Oil-Gas-Exploration, 100k-1MM)
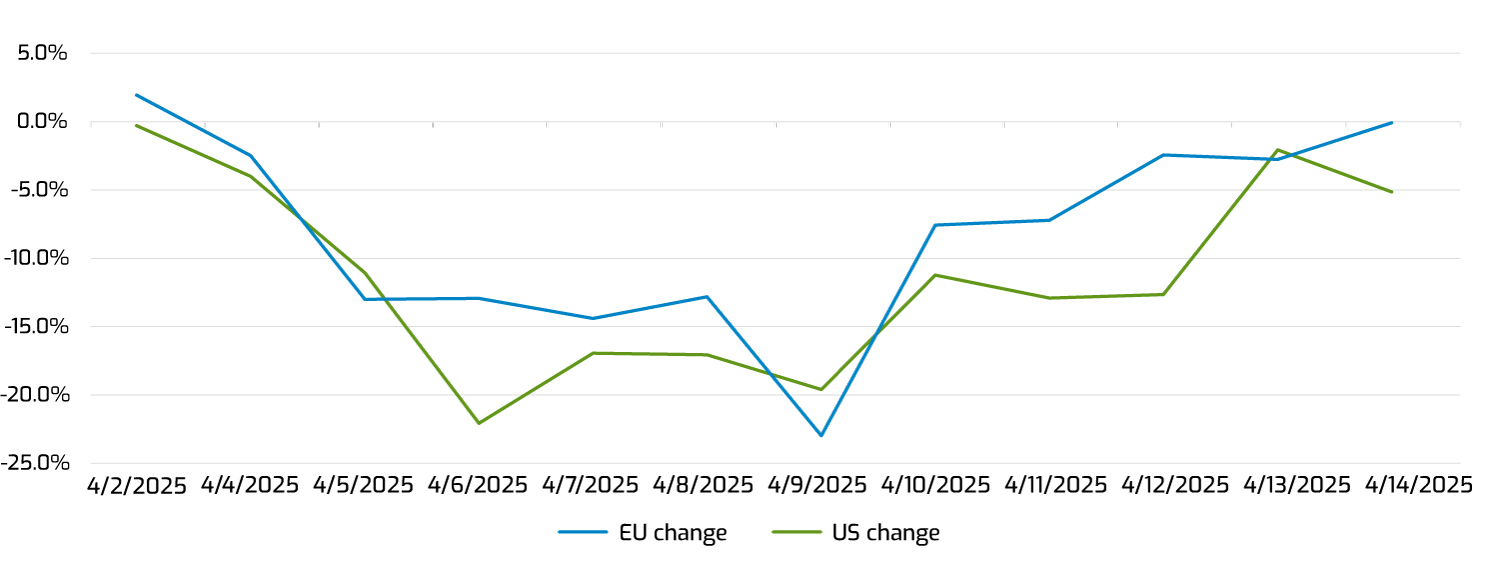
Intra-day updates of Tradability can also give an indicator of market reaction to news and liquidity events. A recent notable example of this was the April 2025 volatility spike seen across the market. As uncertainty rose, we observed a sharp difference in market-wide Tradability predictions. Between President Trump’s announcement on April 2nd and the peak of market volatility from April 8-10th, Tradability predictions dropped roughly 20% on a market-wide basis, reflecting uncertainties felt by liquidity providers (figure 4). More granularly, there were several occasions where average Tradability predictions fell by nearly an entire response on an hour-over-hour basis intraday*.
Figure 4: Median Tradability values vs April 1st, 2025
In conclusion, Tradability is a tool that has a wide set of use cases across the trading spectrum. Order-specific insights from the model can help illuminate expected trading costs and outcomes, and a higher-level view of aggregate predictions can be used to track sentiment, net flows, and intraday changes on an issuer, sector, or market-wide basis. By integrating Tradability into workflows, market participants can better navigate liquidity events and volatility while executing existing orders with greater pre-trade assurance.
*Tradability scores were capped at 10 during this period. Tradability was later uncapped starting on 5/10/2025, revealing a wider range of scores and more precise predictions.