
AxessPoint: Block trading activity in US credit during the 2020 crisis

Highlights
- Both US High Grade and US High Yield capped trade activity saw significant growth in the first half of 2020.
- The largest trade sizes were an area of opportunity for buyers, as buys outperformed sells of similar size by as much as 17 cents.
Capped trade activity during market turmoil
Our previous AxessPoint described FINRA’s timeline for disclosing uncapped trade quantities. Now that the complete data for the first half of 2020 is available, we can look carefully at March-June 2020, the most volatile period since the 2008 financial crisis. Trade counts and volumes rose sharply as investors rushed to update their strategies in the quickly shifting market. This was even more true in High Yield names, as concerns around downgrades and fallen angels led to forced sales for some and opportunities for others.
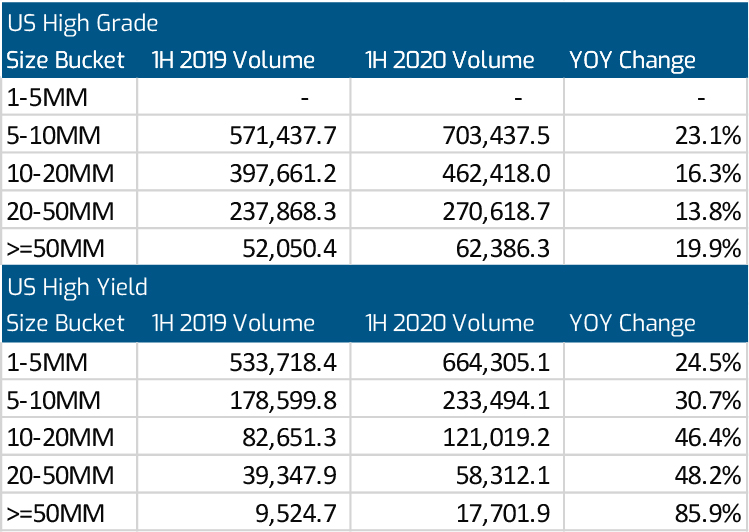
High Grade block trades saw increased activity overall in the first half of 2020, in line with count and volume growth market wide. March, April, May, and June had the four largest HG block trade counts on record, with April’s total of over 23,000 the highest among them. Further, there were more than 10,000 HG block trades of 20MM or more over the same period, a record as well. The C2D buy/sell ratio in this segment peaked in March at a rate of 1.2 Buys/Sell.
High Yield block volumes rose by 29.8% overall, outpacing volume growth as a whole. HY block volumes over 10MM exploded, growing by 50% YOY. There were more HY block trades of 50MM and above in 1H 2020 than in all of 2019. The HY market remained very well-balanced, at 1.08 Buys/Sell.
Measuring performance of block trades
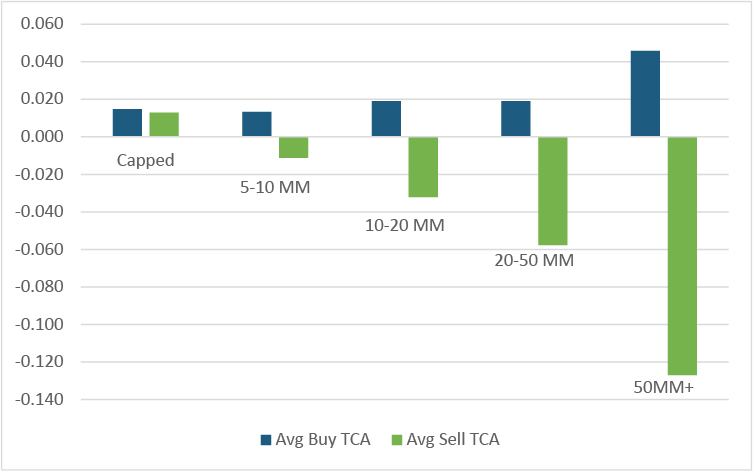
The uncapped data allows us to measure trade performance for specific size buckets that are normally masked. Looking at the universe of HG C2D buys and sells for the first half of 2020, the original capped data set shows that client buys outperformed Composite+™ offer price at the time of execution by 2.9 cents, and client sells underperformed the CP+ bid by 1.3 cents on a median basis. Median market-wide C2D TCA vs. CP+ ranged from -1.3 cents in January to -7.8 cents in March.
Using the uncapped data, we can provide a more granular breakdown that shows this performance gap between buys and sells grows sharply for larger block sizes. For trades from 5-10MM and 10-20MM, the premium remained close to the overall value, at 2.5 and 5.1 cents, respectively. For blocks between 20 and 50MM, the premium rose to 7.7 cents. For trades over 50MM, the number was a sizable 17.3 cents. High yield numbers showed a similar trend, with the premium stretching from 4.8 cents for trades from 1-5MM to 17.4 cents for trades of 50MM and above.
1H 2020 US High Grade Median TCA vs. Composite+ ($)
Uncapped TRACE from MarketAxess
Using an intelligent mapping engine, the uncapped TRACE report has been linked to the original trade records as an add-on to the standard Corporates and 144a feed. This provides accurate trade-level information for transactions that were previously capped, going all the way back to the inception of the feed in July of 2002.
For questions or follow-up, email our data scientists at research@marketaxess.com.