
AxessPoint: Comparing the March 2022 volatility to March 2020 in US Investment Grade

Highlights
- March 2022 was the most volatile month in the US credit market since the height of the Covid-19 crisis in March 2020.
- Contrary to the March 2020 sell-off, credit traders were mostly takers of the March 2022 volatility episode as corporate bond price changes were mainly decided by movements in another asset class, namely US treasuries.
- This could explain why the March 2022 increase in corporate bond transaction costs was contained: despite volatility reaching 40% of what it was in March 2020, transaction costs were only 33% of what they were then.
Volatility and transaction costs
Daily credit spread, treasury yield and yield changes
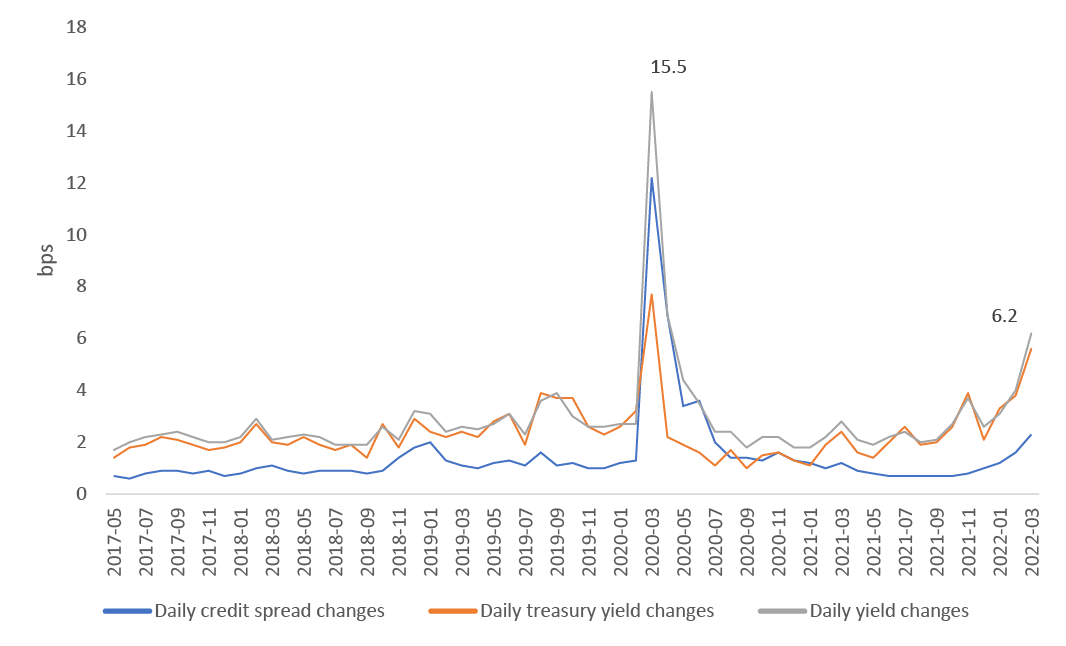
Fig 1: Daily credit spread, treasury yield and yield changes.
Figure 1 shows the median daily absolute Composite+ credit spread, treasury yield and yield changes, in bps, for US investment grade (IG) corporate bonds. In March 2022, the median absolute daily yield change, a proxy for volatility, reached about 40% of what it was at the height of the Covid-19 crisis in March 2020 (6.2 bps vs 15.5 bps). In March 2020, corporate bonds sell-off led to spread to treasury changes being the main driver behind price movements whereas in March 2022, the primary drivers were changes in treasury yields. Indeed, the volatility was driven outside of the credit market, more specifically by the war in Ukraine and the actions of the Federal reserve to curb inflation. This can explain why transaction costs as measured by the Composite+ bid-ask spread were only about one third of what they were then (4.5 bps vs 14.0 bps).
Composite+ bid/ask spread in yield terms
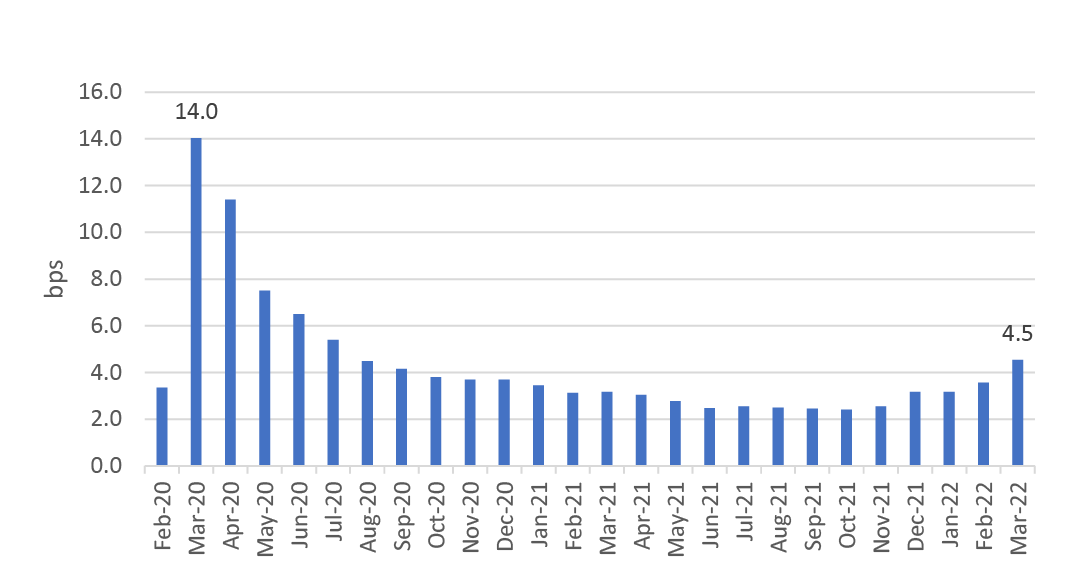
Fig 2: Composite+ Bid/Ask Spread in yield terms
Treasury yields as the main drivers of corporate bond price changes
Except for the covid-19 crisis, over the past 5 years, daily treasury yield changes have been consistently larger than daily credit spread changes. In 2021, the median absolute daily credit spread change was 0.87 bp while the median absolute daily treasury change was 2.13 bps. Knowing that corporate bond prices are a direct function of yield [corporate bond yield = treasury yield + credit spread], in 2021, treasury yield changes were responsible for 71% of daily US IG corporate bond price changes. Even though many of the 40,000 US IG corporates only trade sporadically, they benefit from the real-time price discovery process happening in Treasuries.
For questions or follow-up, email our data scientists at research@marketaxess.com