
AxessPoint: Euro Investment Grade price dispersion during volatility

Highlights
- Price dispersion in EUR IG drastically increased throughout February and peaked in March. Since April, it has started to decrease and has stabilized at nearly the pre-crisis level.
- The distribution of price deltas between trades and the corresponding Composite+™ side flattened during the crisis but stayed centered around zero.
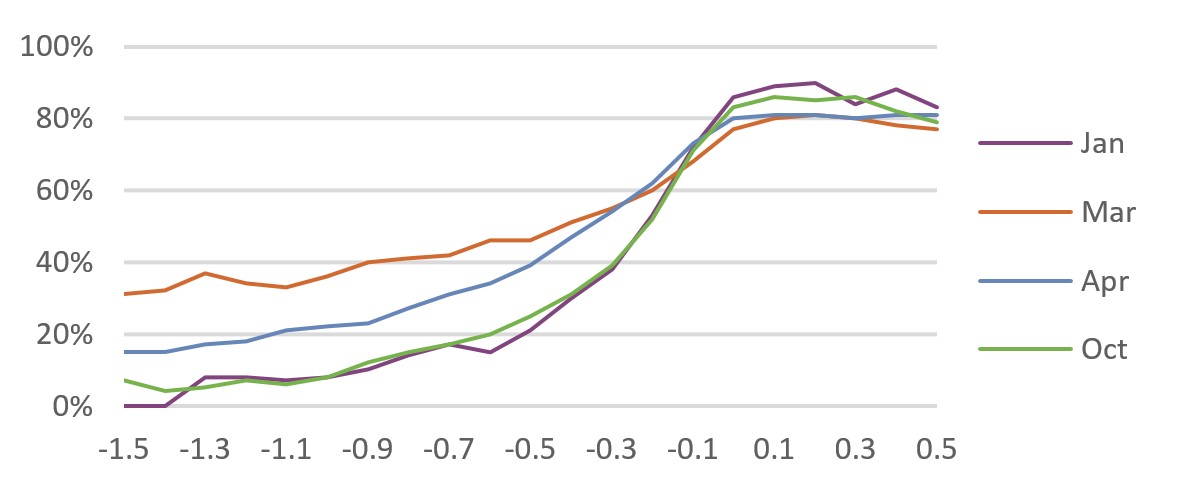
- Win rates—which are driven by client acceptance rates—on levels wider than Composite+ side peaked in April and are now decreasing to pre-crisis levels.
Measuring price dispersion
We measure price dispersion through two indicators: A) The price delta between the traded level of RFQs executed on MKTX and the corresponding Composite+ side – a positive delta means the level is better than the Composite + bid/offer while a negative delta means the level is worse than Composite+ side and B) The win rate of the liquidity provider sending the most competitive level to an inquiry, as a function of the distance to the Composite+ side. Price dispersion can be seen as a secondary risk, with bid/ask the primary pricing risk (read our prior AxessPoint on the volatility in bid/ask spreads brought on by the COVID-19 pandemic).
Euro Investment Grade price deltas
Pre-crisis price dispersion was low, with the distribution of price deltas between traded levels and Composite+ side peaking around zero. Trades were tightly distributed around Composite+, demonstrating its accuracy and unbiased nature.
Distribution of price deltas vs Composite+ side
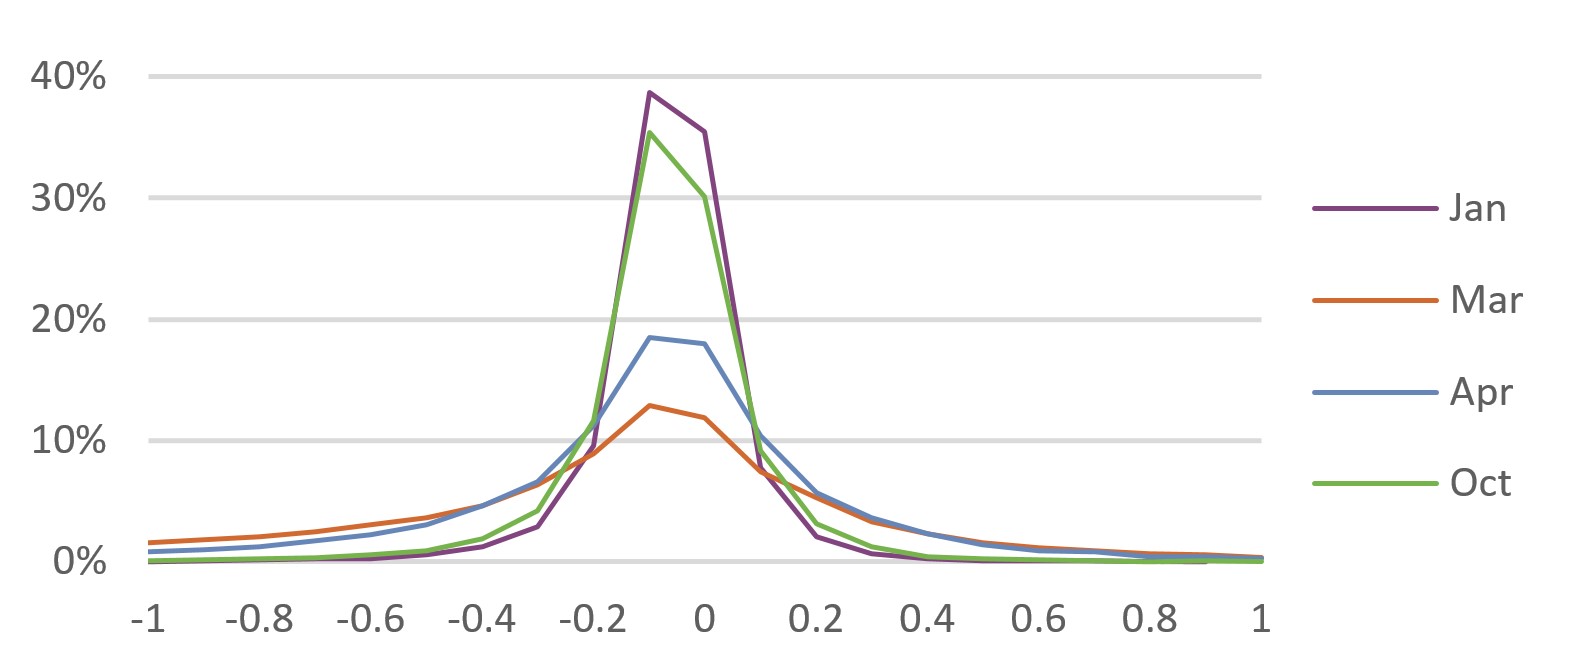
As shown in the above plot, in January, 74% trade levels were within 10 cents of Composite+ side and less than 2% were more than 40 cents wider than Composite+ side.
During the crisis, there was in shift of liquidity demands, and alongside extreme price uncertainty which lead to higher price dispersion. This price dispersion drastically increased throughout February and March. The distribution of price deltas quickly flattened – even if still centered around zero. 25% trades were within 10 cents of Composite+ vs 30% were 40 cents wider or worse in March.
Starting in April however, we saw a slow return to normal in price dispersion. The tails of the distribution tightened again, while the peak around Composite+ increased: in October, 65% trades were executed within 10 cents of Composite+ while less than 3% were executed more than 40 cents wider than Composite+.
Euro Investment Grade win rates
RFQ responses that are more competitive than the corresponding Composite+ side have a higher chance of execution. During the crisis win rates on levels far from Composite+ reached a peak; best level RFQ responses that were 40 cents wider than Composite+ side had a win rate of 21% in January, compared to over 46% in March and 25% in October. RFQ pricing is becoming increasingly competitive as participants adjust to the new normal.
Win rate vs Composite+ side
For questions or follow-up, email our data scientists at research@marketaxess.com.