
AxessPoint: Shifting primary dealer net positions and risk appetite

Highlights
- During the crisis period, primary dealers shrunk their net positions to a low of $30 billion as they moved to reduce risk. US High Grade Composite+™ bid-ask spread widened considerably rising from 3 bps to over 30 bps at its widest.
- After the Federal Reserve committed to provide liquidity to corporate bond markets, primary dealer net positions reversed and expanded while bid-ask spread tightened.
Delving into net dealer positions
The COVID crisis caused primary dealers to shrink their net positions from a pre-crisis peak of $40 billion to a low of $30 billion. The plot below shows the S&P 500 index and primary dealer net positions in 2020 YTD and highlights the change during the key dates of the crisis (S&P 500 peak and Fed announcement).
2020 YTD primary dealer net position vs S&P 500
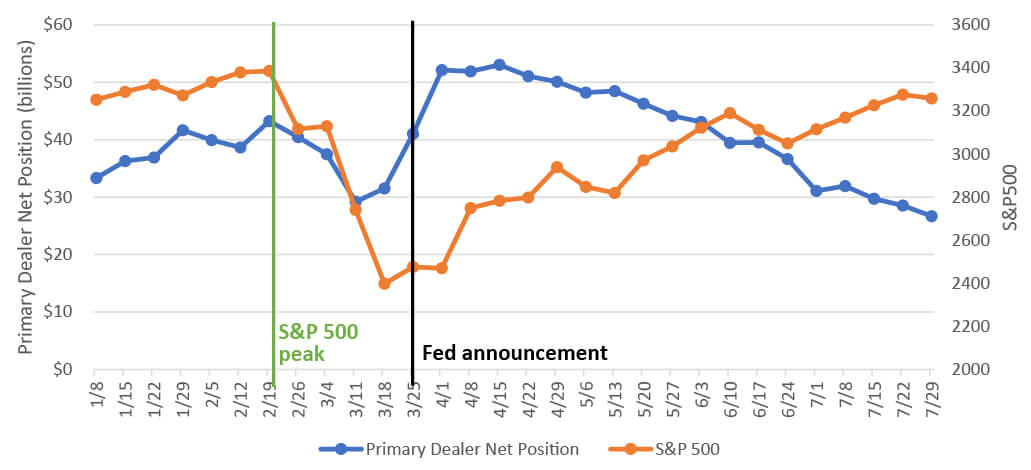
However, following the Fed’s commitment on March 23rd to support liquidity by potentially buying corporate bonds and fixed income ETFs, primary dealer net positions expanded from a low of $30 billion to $50 billion as dealers increased market-making activities, signally stronger market support.
Analyzing TRACE volume
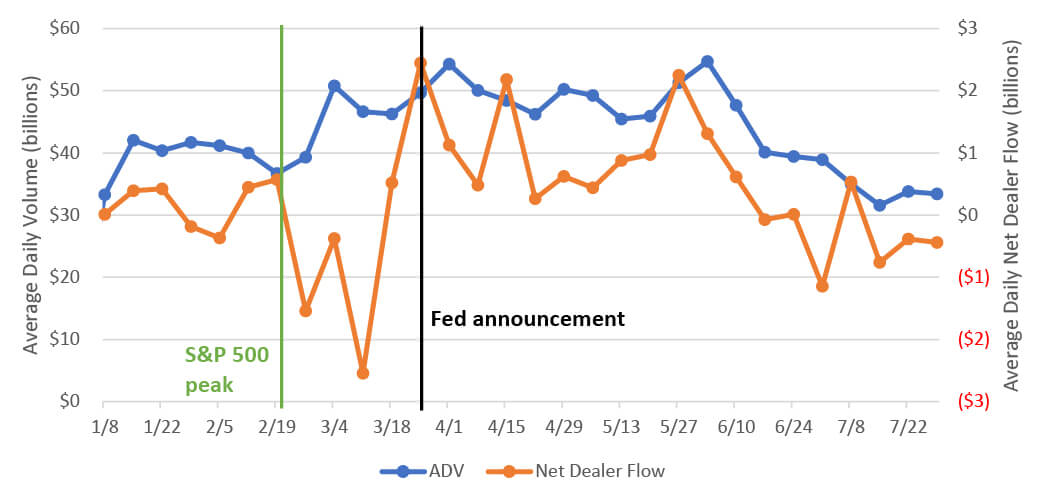
During the crisis, TRACE volumes grew to record levels with very elevated bid-ask spreads (see “A new normal for global credit market bid/ask spreads”). After the Fed’s March 23rd announcement, volatility decreased while bid-ask spreads and TRACE volume normalized. The plot below shows the average daily TRACE volume and the average daily net dealer flow. A negative net dealer flow indicates that dealers were selling more than they were buying. Note that right before the Fed announcement, dealers were selling more than they were buying. Immediately after the announcement, dealers were buying more than they were selling. The average daily TRACE volume spiked during the crisis and gradually came down following the same direction as the average daily primary dealer net position.
TRACE average daily volume vs daily net dealer flow
Increased risk appetite
Dealer activities during the COVID crisis evolved rapidly as the Fed announced new QE policies. The initial stage of the crisis saw a drop in dealer-provided liquidity and an increase in bid-ask spreads, while dealers shrunk their net positions. However, as the Fed made signals of support for the market, dealers expanded their net positions and investors, with renewed risk appetite, provided inflows into corporate bonds. This ultimately drove tighter bid-ask spreads.
Uncapped TRACE from MarketAxess
Using an intelligent mapping engine, the uncapped TRACE report has been linked to the original trade records as an add-on to the standard Corporates and 144a feed. This provides accurate trade-level information for transactions that were previously capped, going all the way back to the inception of the feed in July 2002.
For questions or follow-up, email our data scientists at research@marketaxess.com.