
How trades move markets: a data driven exploration of market impact

Executive Summary
Market impact is measurable and manageable. It is driven by liquidity, size, and execution choice.
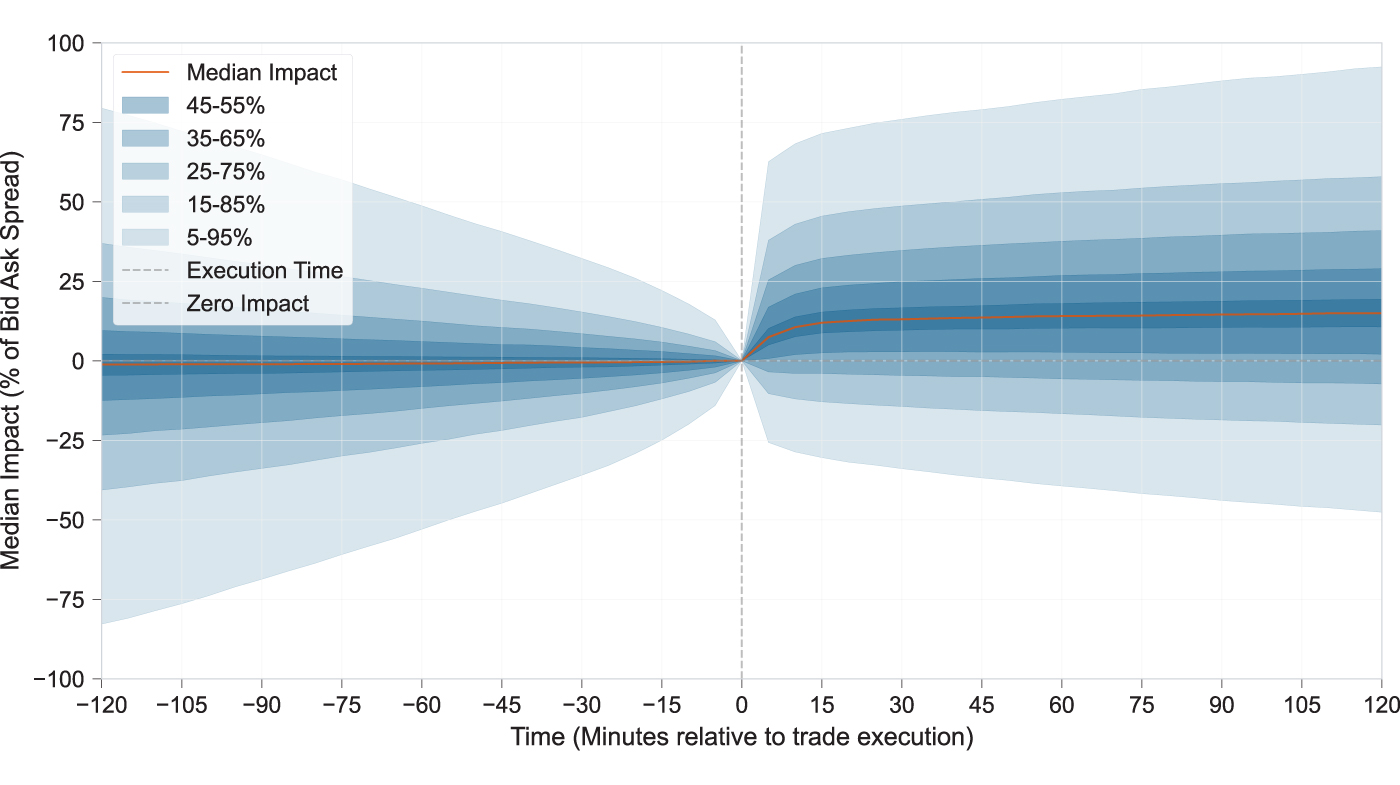
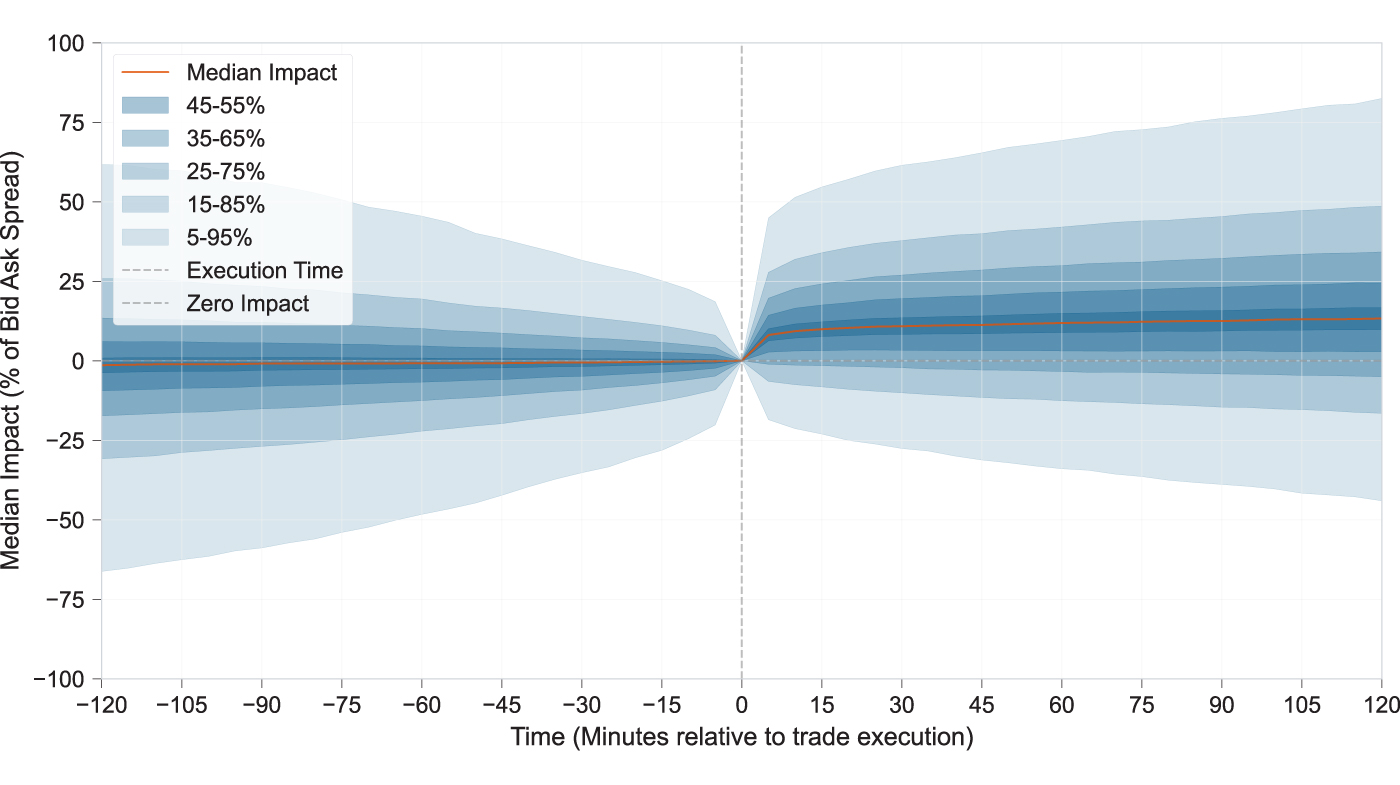
Median post-trade impact is 13% of the bid-ask spread in US HG and 11% in EUR IG.
Liquidity matters most: low-liquidity US HG bonds show nearly twice the median impact of high-liquidity bonds.
Size matters but not indefinitely: impact rises up to about $2 million, then largely plateaus.
When market interest aligns with the trade, post-trade price impact tends to be amplified; when it runs counter, the impact is often muted.
All-to-all trading such as Open Trading®, does not incur the information leakage cost many assume; broader liquidity access does not appear to drive a proportionate increase in market impact.
Introduction
Market impact is commonly seen as the unavoidable cost of revealing trading intent. Every trade signals information to the market, and that signal helps form the next price. The assumption is that the more broadly a trade is distributed, the more the market learns, the more prices are expected to move. It suggests a trade-off between access to liquidity, price competition, and information leakage. This shapes how traders think about counterparty selection, potentially confining how widely they send inquiries and how much competition they invite.
But analyzing the data more comprehensively tells a different story. It shows that market impact is not primarily determined by information leakage associated with broader distribution. It is driven first by liquidity, then by trade size, and finally by execution choice, with prevailing market conditions such as market skew further influencing outcomes. Additionally, the penalty for broader distribution is often smaller than traditionally expected. In many cases, expanding access to liquidity, including through Open Trading, does not meaningfully increase post-trade price movement. Counterparty selection, then, need not be constrained. It can be used as an important tool to balance competition and the dissemination of trading interest.
Methodology
To measure impact, we need a benchmark that updates frequently and reflects where the market is trading in real time. We use CP+™, our AI-driven pricing model, because it provides 99% coverage across the relevant universe and refreshes every 15 seconds on average. Our measure looks at the move in CP+ mid spread in the minutes after each trade, 30 minutes unless otherwise noted. We isolate the price component of spread changes so the result reflects the effect of the trade itself rather than broader benchmark moves. We then sign the move so a positive value represents movement in the direction of the trade, tightening for buys and widening for sells.
The sample includes 186,000 US High Grade trades and 52,000 EUR Investment Grade trades executed on MarketAxess in H2 2025. It covers notional sizes from $150,000 to $25 million and only includes trades executed within one bid-ask spread of CP+ (see Appendix for additional details).
Measuring impact
Trades do move markets. In the 30 minutes before a trade, prices can move by as much as 33% of bid-ask spread, but the median move is 0%. After the trade, the distribution shifts meaningfully: post-trade moves reach 76% in US HG and 62% in EUR IG, with median moves of 13% and 11%, respectively. The takeaway: post-trade repricing is real, measurable, and distinct from normal market noise.
How to Read: The visual below displays the median impact of trades relative to their trade time. The bands represent the middle 45th to 55th, 35th to 65th, 25th to 75th, 15th to 85th and 5th to 95th percentile of trade impact outcomes. Collectively, they represent the distribution of post-trade price movements by timestamp.
US HG median impact relative to trade time
EUR IG median impact relative to trade time
How to Read: Rows show trade outcome percentiles; columns indicate time relative to execution. For example, 5% at +30m means 5% of trades move more than 34% against the trade in 30 minutes, while 95% shows 5% move more than 76% in favor.
US HG
| -30m | -15m | Trade time | +15m | +30m | |
|---|---|---|---|---|---|
| 5% | -36% | -25% | 0% | -30% | -34% |
| 25% | -10% | -7% | 0% | -4% | -5% |
| 50% | 0% | 0% | 0% | 12% | 13% |
| 75% | 9% | 6% | 0% | 32% | 35% |
| 95% | 32% | 22% | 0% | 72% | 76% |
EUR IG
| -30m | -15m | Trade time | +15m | +30m | |
|---|---|---|---|---|---|
| 5% | -35% | -28% | 0% | -23% | -28% |
| 25% | -9% | -7% | 0% | -2% | -2% |
| 50% | 0% | 0% | 0% | 10% | 11% |
| 75% | 7% | 6% | 0% | 24% | 27% |
| 95% | 32% | 25% | 0% | 53% | 59% |
Liquidity
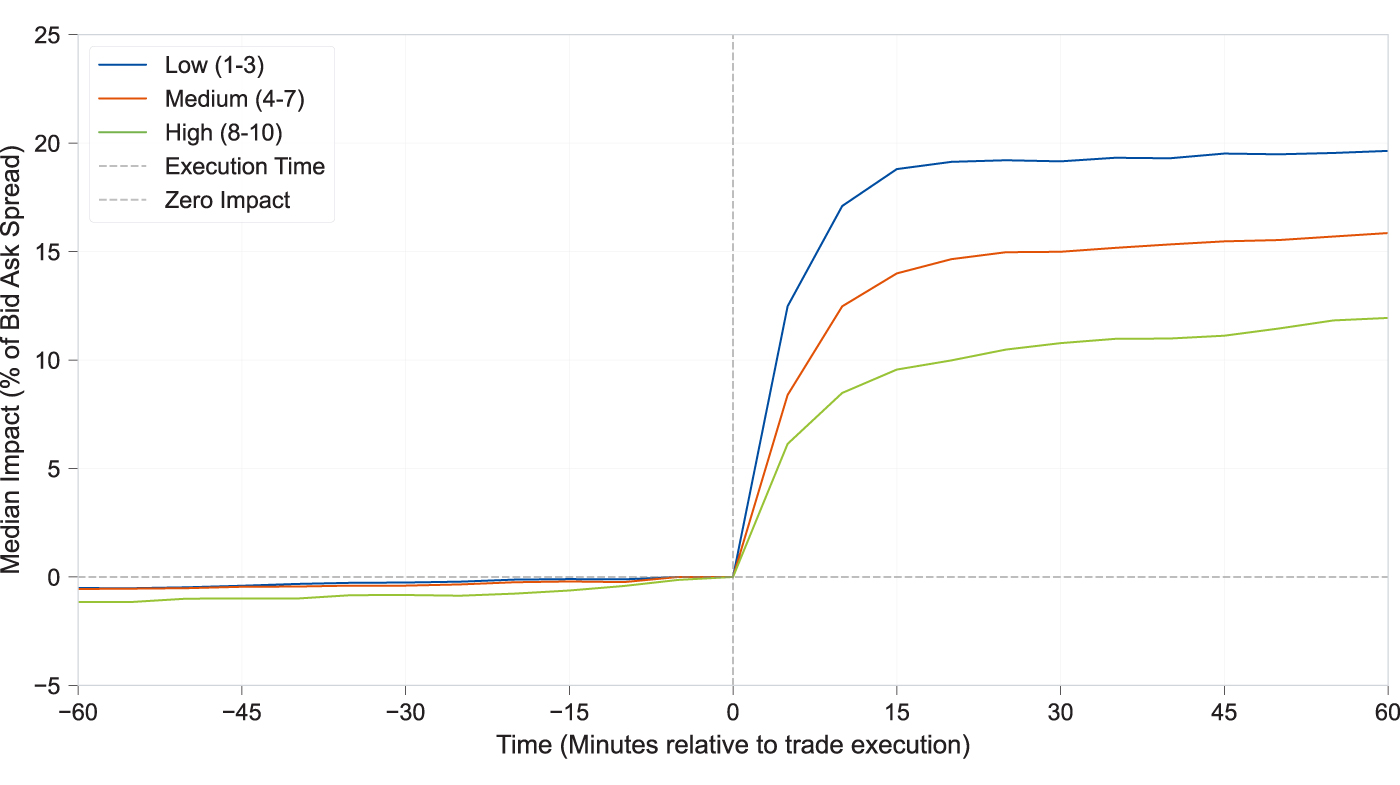
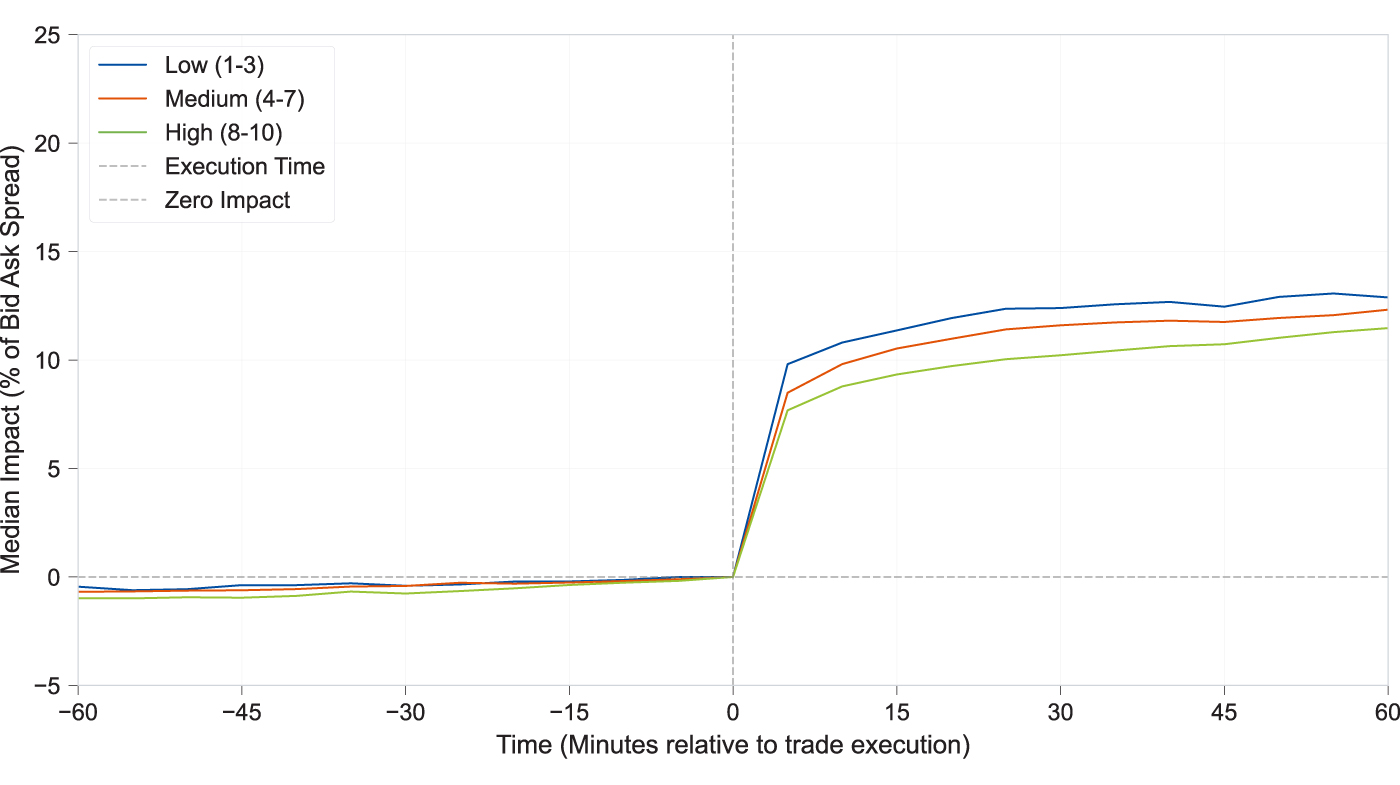
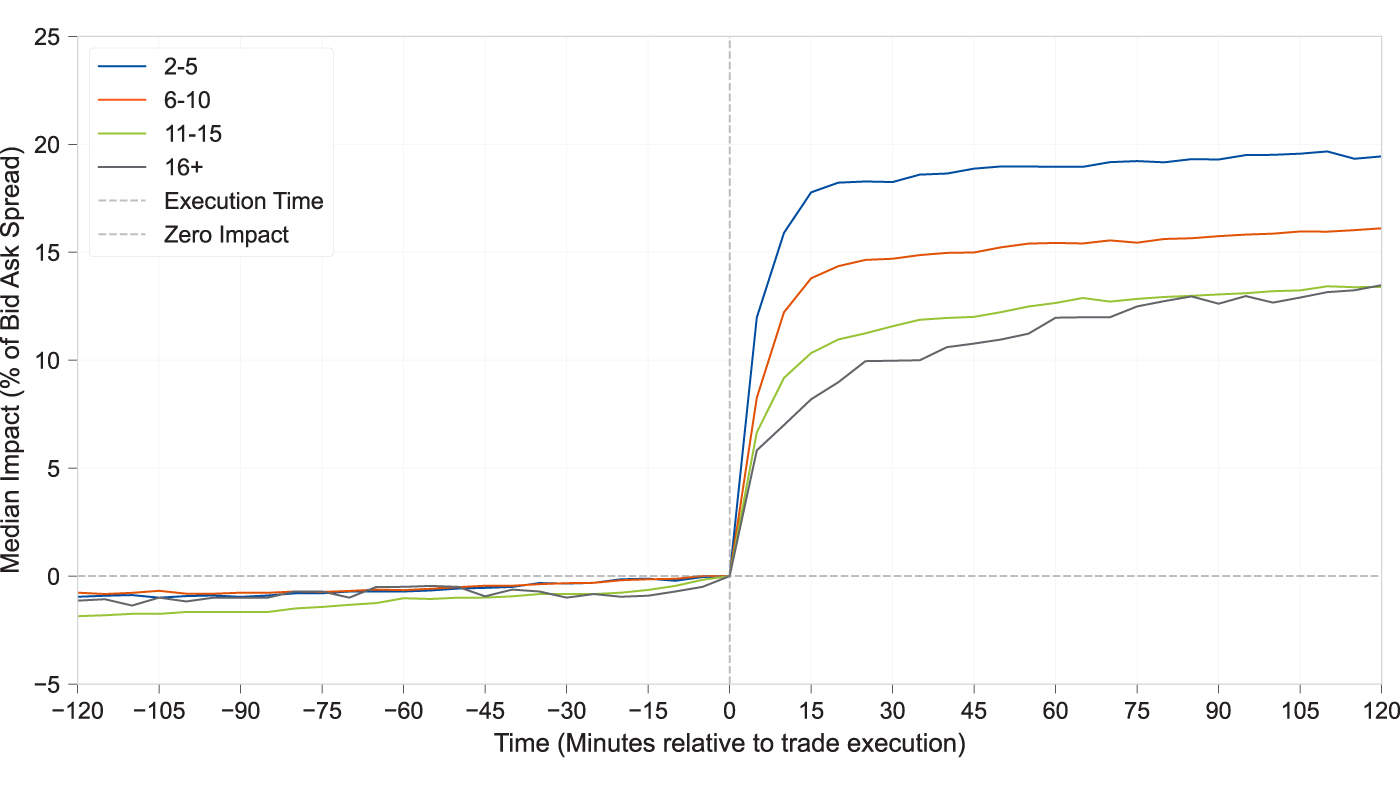
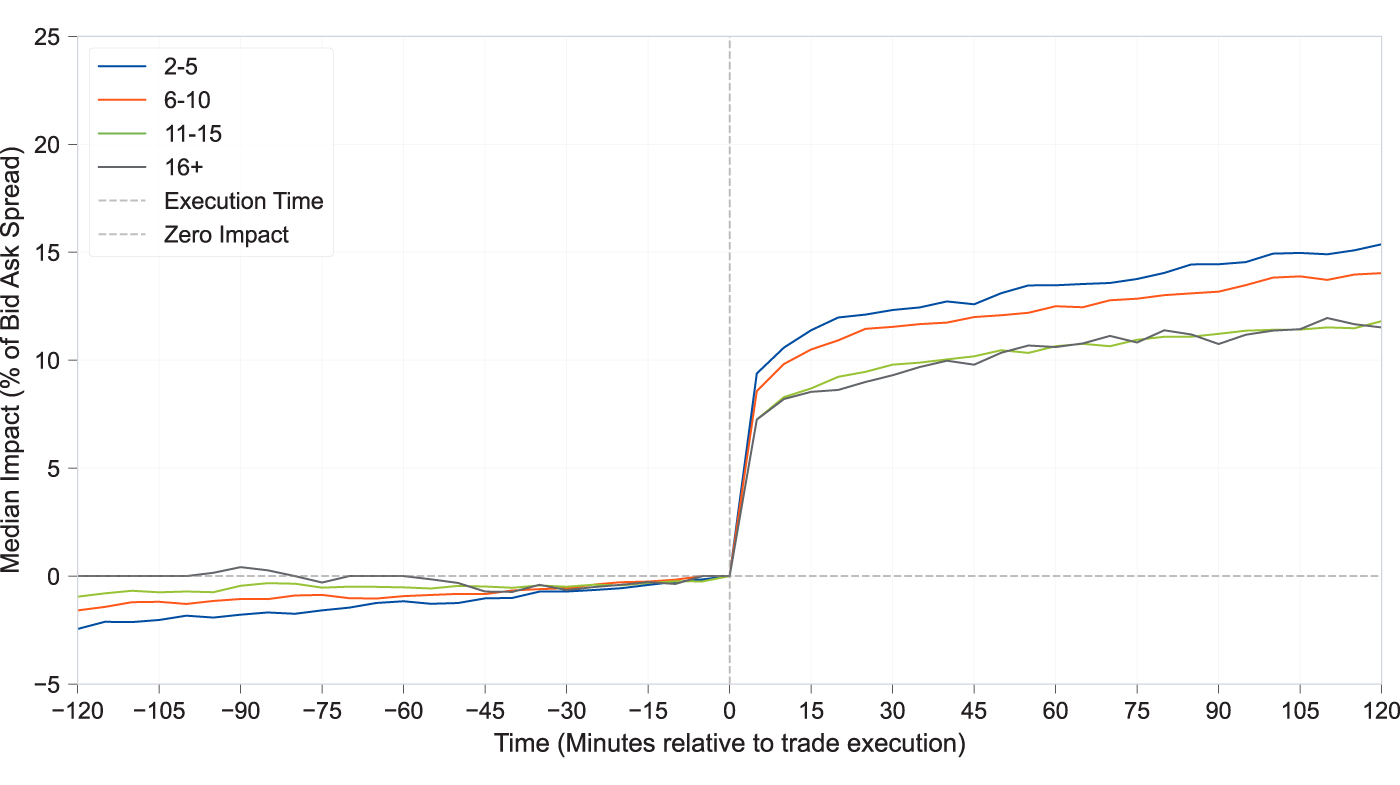
Liquidity is the strongest predictor of market impact. When the bond is harder to trade, the market moves more to absorb the transaction. In US HG, bonds with a low Relative Liquidity Score of 1-3 show a median impact of 19% of bid-ask spread, versus 11% for bonds with a high score of 8-10. In EUR IG, the gap is smaller but still visible at 12% versus 10%. The same pattern appears even more clearly in Tradability, our AI-driven response count prediction solution: bonds expected to receive fewer than five responses show a median impact of 18% in US HG and 12% in EUR IG, while bonds likely to receive more than ten prices back show 10% and 9%, respectively.
The difference is more pronounced in US HG because the liquidity spread between the easiest and hardest bonds to trade is wider. In US HG, bonds with a liquidity score of 1 have a median CP+ bid-ask spread that's 10.9x wider than those with a score of 10. In EUR IG, that gap is 3.7x.
How to Read: The charts below illustrate the median impact (as a percentage of bid ask spread) by liquidity profile across different time deltas.
US HG median impact relative to trade time by RLS bucket
EUR IG median impact relative to trade time by RLS bucket
US HG median impact relative to trade time by tradability bucket
EUR IG median impact relative to trade time by tradability bucket
Trade size
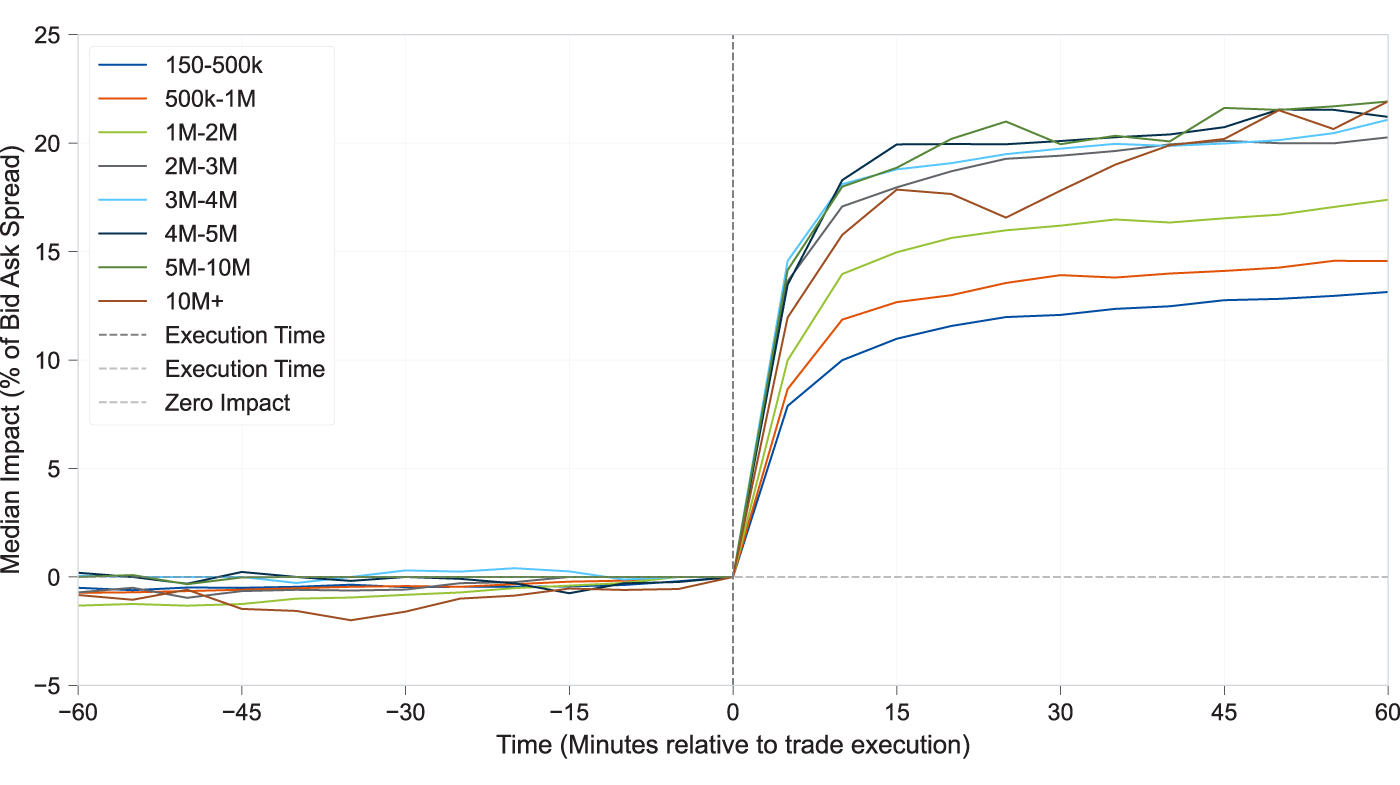
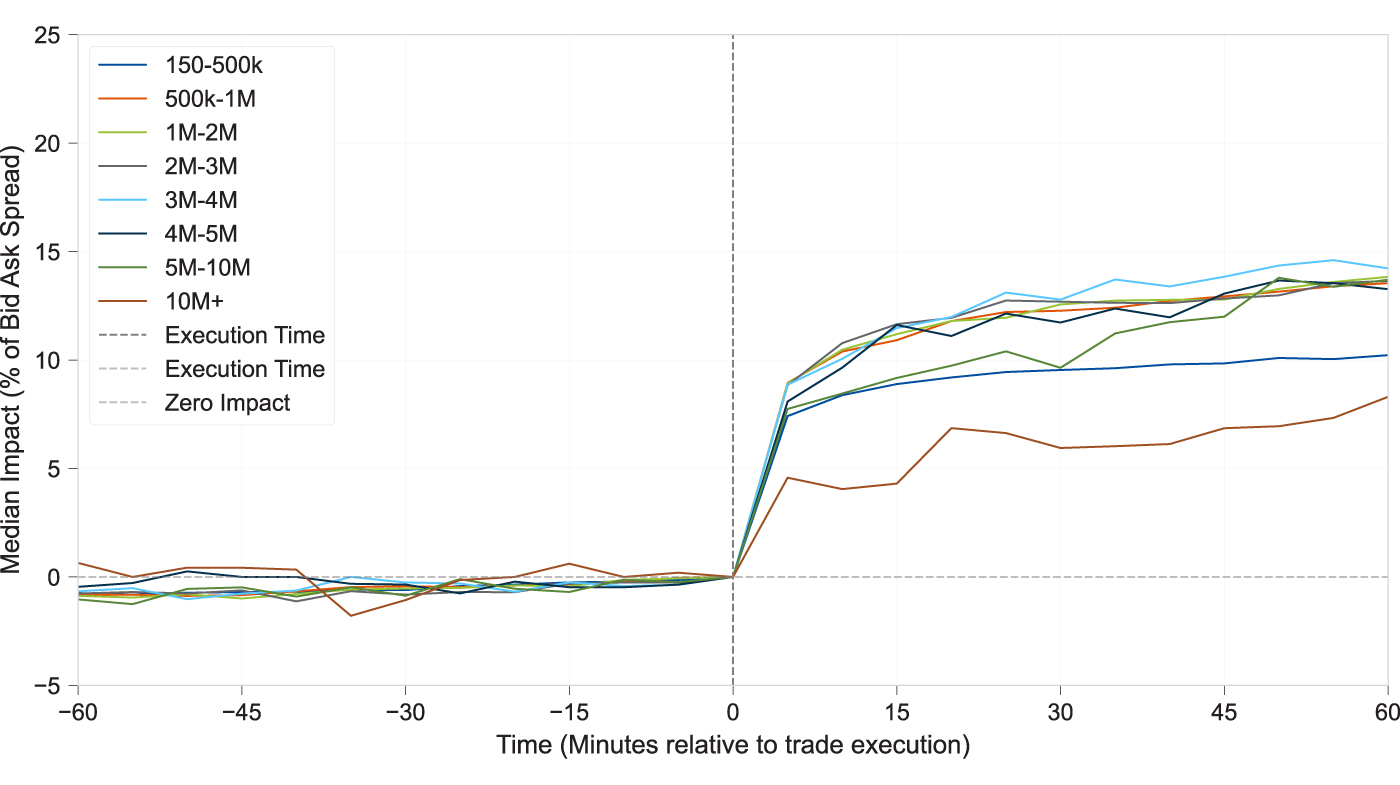
Trade size plays a significant role in market impact, with larger deals typically causing greater disruption. However, this effect diminishes in transactions above $2 million in notional size. Trades with less than $500,000 in notional volume typically have a median impact of 13% of the bid-ask spread (10% in EUR IG). For trades between $1 million and $2 million, the median impact increases to 16% (13% in EUR IG). Transactions exceeding $2 million see an impact of 19% in US HG (13% in EUR IG), which remains consistent for larger trade sizes. This plateau can be partially attributed to what information about trades are revealed to the entire market.
US HG trades are reported to TRACE, meaning the market (CP+ included), receives trade information from this source. US HG trades are capped at $5 million notional in TRACE. This results in all trades over $5 million having the same informational footprint from the TRACE tape, except to the parties invited to the inquiry. However, the minimal difference in impact between $2 million and $5 million trades, where the true size of the trade is disclosed, indicates that increasing volumes beyond $2 million do not substantially increase market disruption. In EUR IG, trade tapes are not as common, resulting in less transparency around trade volume. This is likely to contribute to the reduced variation in market impact across volume in EUR IG. In summary, while larger trade sizes do tend to have more influence, their effect may be less significant than anticipated.
US HG median impact relative to trade volume by volume bucket
EUR IG median impact relative to trade volume by volume bucket
Market skew
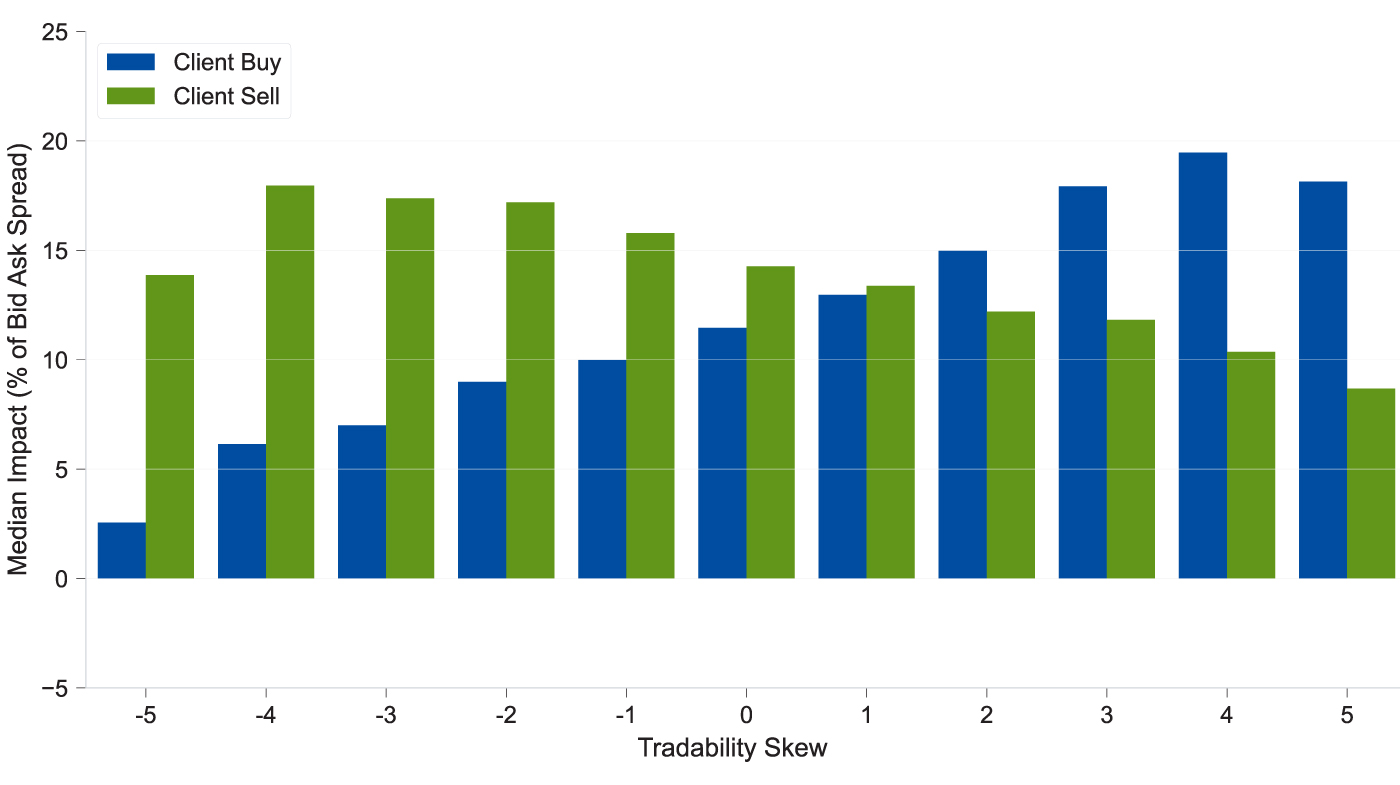
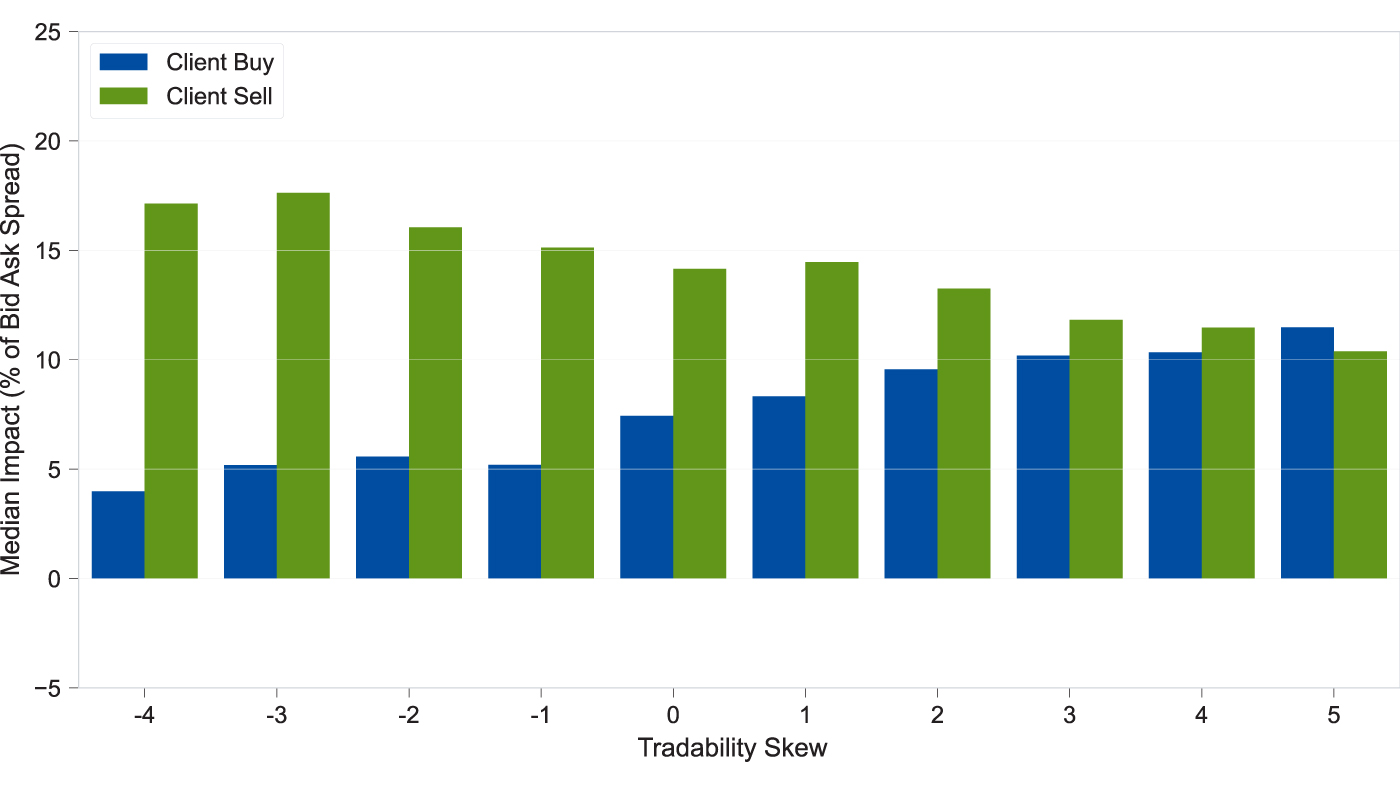
Execution quality depends not just on bond liquidity, but on which side of the market already shows interest. Market impact increases when one side shows strong interest, as measured by our Tradability skew, the gap between bid and offer predictions. When a trade aligns with the prevailing skew, indicating strong interest from one side, the average effect rises to around 17% of the bid-ask spread in US HG and 13% in EUR IG. In the absence of skew, the average impact drops to 13% in US HG and 11% in EUR IG. Conversely, trades executed against the skew experience a reduced average impact of 8% in both US HG and EUR IG. When the market is already leaning one way, trading into that imbalance is materially more expensive than trading against it.
US HG median impact by tradability skew and trade side
EUR IG median impact by tradability skew and trade side
Counterparty selection
Broader distribution does not appear to carry the market impact penalty many investors assume. Counterparty selection is a real execution lever because it shapes the trade-off between price competition and information leakage. But the trade-off is not binary. The data suggests traders can often widen access to liquidity without paying a proportionate cost in post-trade repricing.
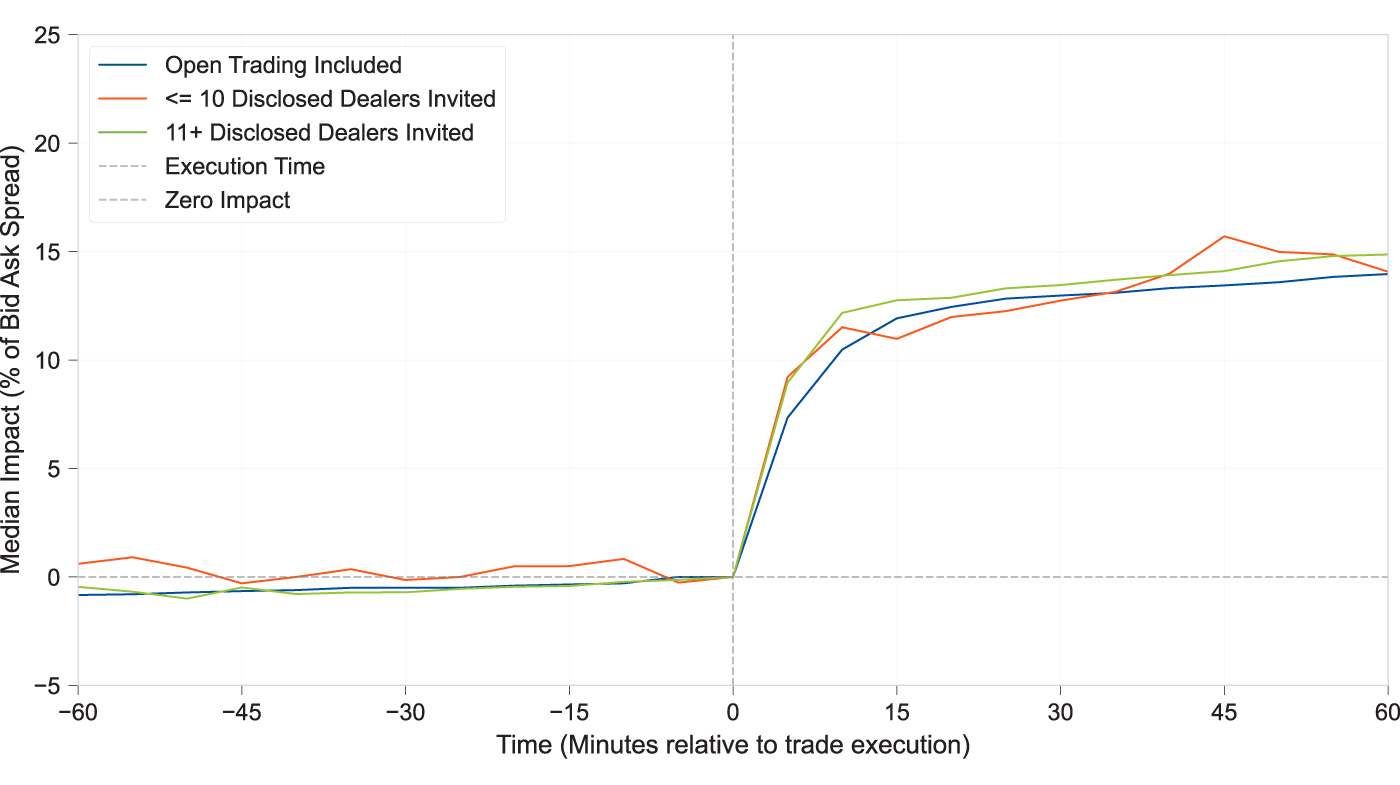
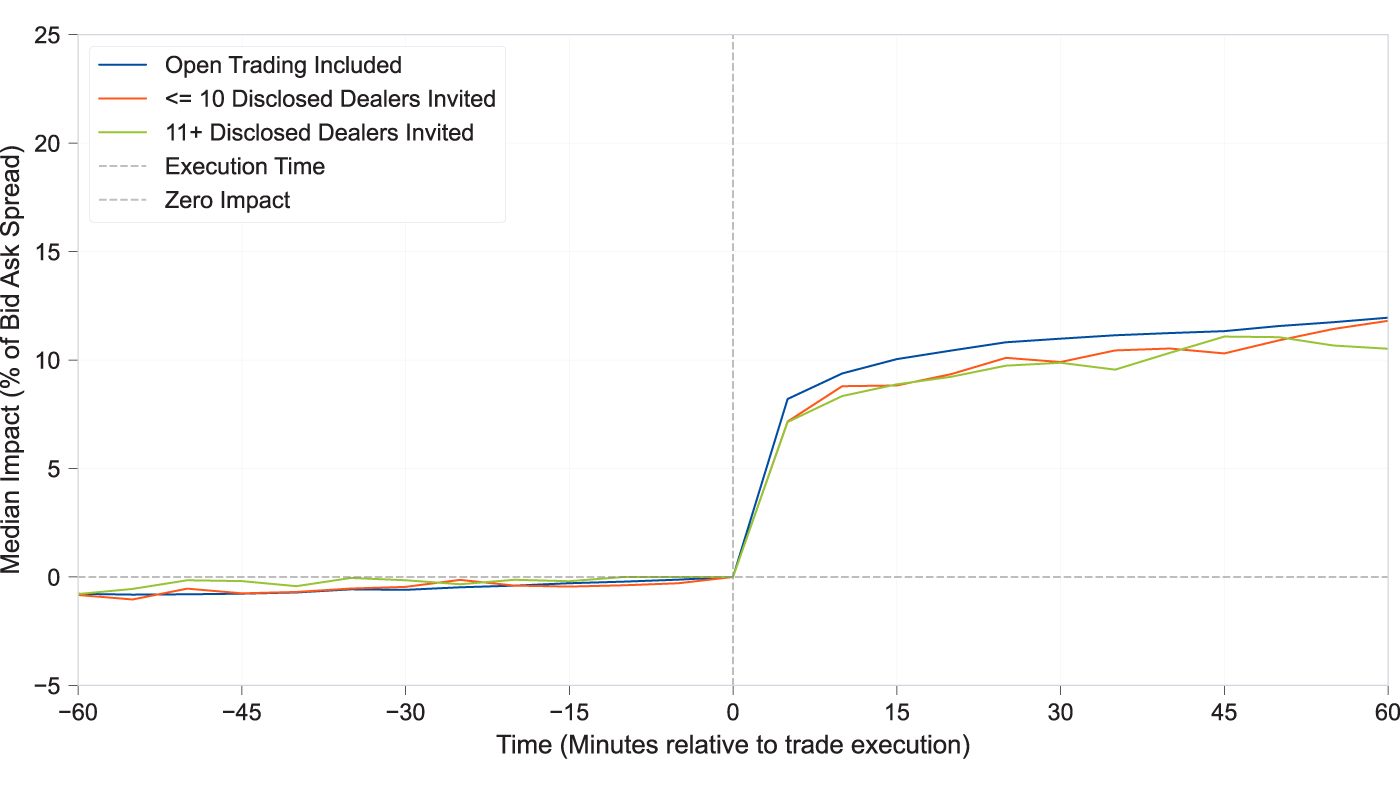
On average, adding three counterparties is associated with roughly 1% of bid-ask spread in extra price improvement, which means broader distribution can create real competitive value. Just as important, the impact cost remains contained. In US HG, including the Open Trading liquidity pool on an inquiry already being sent to a list of disclosed dealers produces roughly the same median post-trade price movement as sending it to just a disclosed dealer list. In EUR IG, the pattern is similar: median post-trade movement is about 10% of bid-ask spread when sent to fewer than 10 disclosed dealers, and about 13% when sent to more than 10 dealers — the same 13% observed when Open Trading is included. The takeaway: access to all-to-all liquidity is not the market impact penalty box. For many trades, it can expand competition without meaningfully changing the repricing outcome.
US HG median impact relative to trade time by OT/DD status & invited dealers
EUR IG median impact relative to trade time by OT/DD status & invited dealers
Conclusion
Market impact is real, but it is hierarchical. Using CP+ as a high-frequency benchmark, this analysis demonstrates a consistent post-trade drift in the direction of the liquidity taker. It is driven first by liquidity, then by size, and then by execution choice, with the information leakage cost of all-to-all trading smaller than commonly assumed.
That matters because liquidity and size are observable before a trade happens. Traders can use liquidity signals such as our Relative Liquidity Score and Tradability to better judge where impact is likely to be highest, how broadly to distribute an inquiry, and when stronger competition is worth the risk of signaling intent.
Execution strategy should adapt to the expected impact profile of the trade. Smaller and more liquid trades can often support broader competition. Larger and less liquid trades may still call for more selective distribution.
The takeaway is clear: worries around information leakage should not deter traders from accessing all-to-all price competitiveness. Ultimately, market impact is primarily driven by liquidity, trade size, and market conditions with the size of the liquidity pool being less of a concern.
Research note
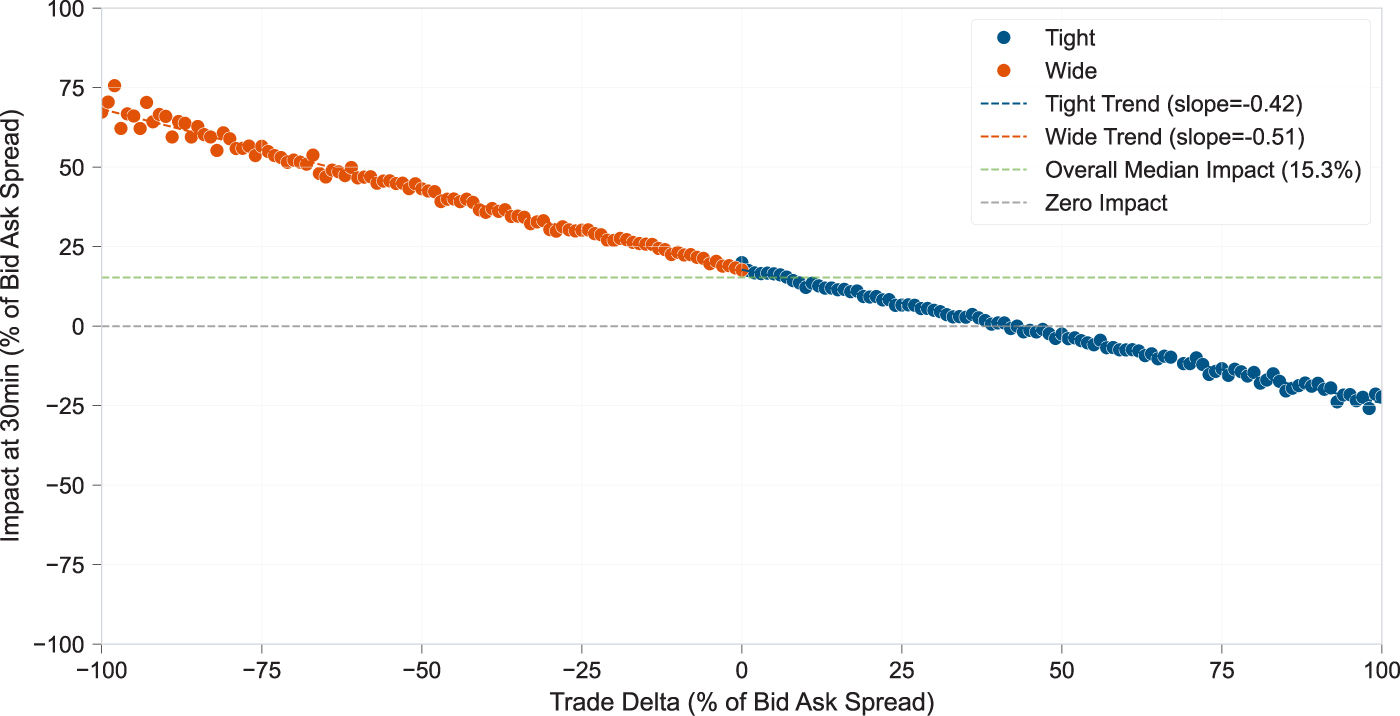
Using CP+ as a benchmark does have an important limitation. The model incorporates the traded level into its next prediction, so wide trades tend to pull the estimate wider and tight trades tend to pull it tighter. CP+ Under the Hood explains this in more detail. In practice, trades still tend to push pricing in the direction of the transaction, even when they print tighter than CP+, validating our findings. Wide trades show a stronger effect because the model signal and the market signal reinforce each other, while tight trades create a conflicting signal. To isolate the market-driven effect rather than CP+ model adjustments, we filtered our sample only on trades where CP+ was within one bid-ask spread of the traded level. That helps ensure the moves we observe are driven more by market activity than by the model adjusting to atypical prints.
US HG impact by trade delta
EUR IG impact by trade delta
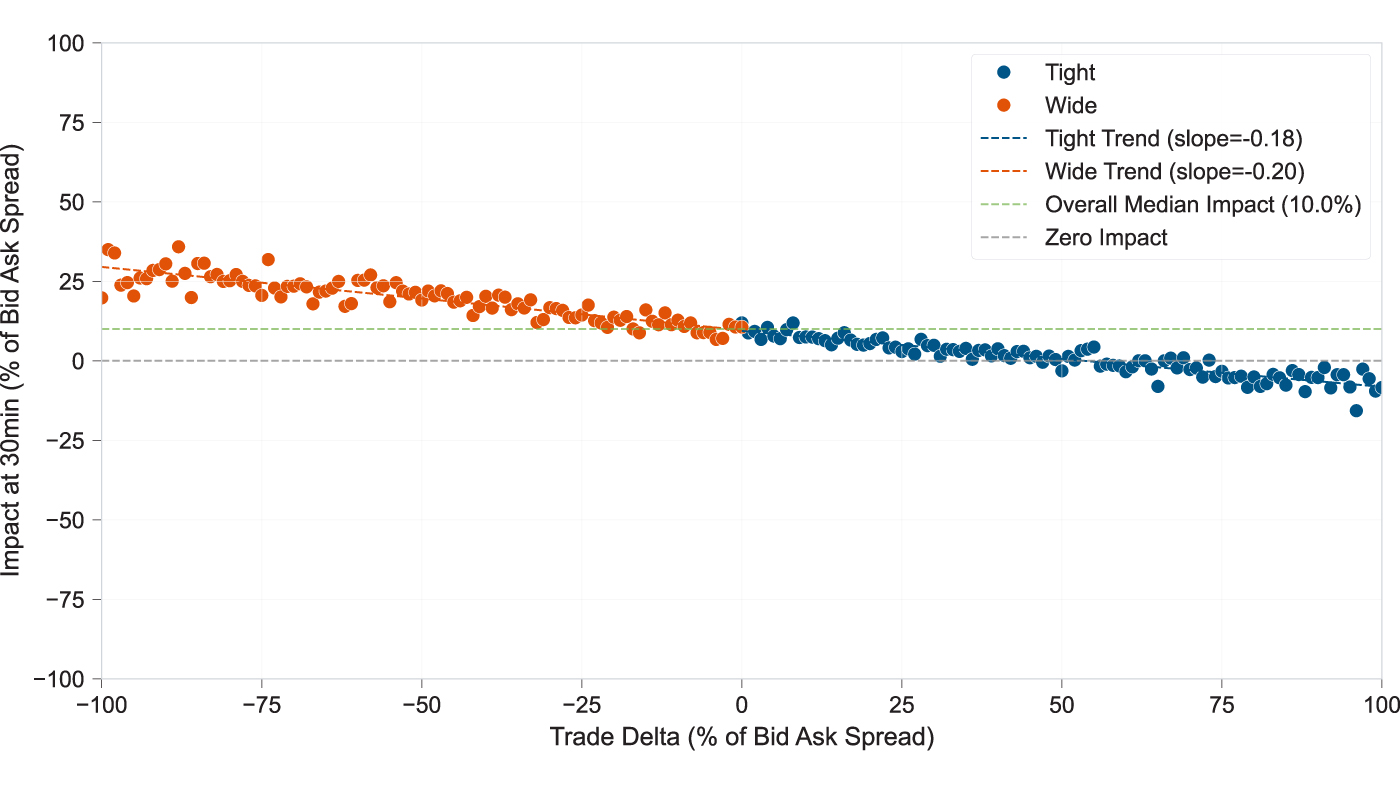
The dataset, like CP+ as a whole, shows no bias towards wide or tight predictions, with both outcomes occurring equally often. This validates our methodology, as the CP+ features that adapt to traded levels respond similarly to widening and tightening across samples. We conducted this analysis on both US HG and EUR IG CP+ models, demonstrating that our results are consistent across markets and models.